 English
  Русский
 Bahasa Indonesia
 Bahasa Malay
 ไทย
ไทย Español
 Deutsch
 Български
 Français
 Tiếng Việt
 中文
中文 বাংলা
বাংলা हिन्दी
 Čeština
 Українська
 Română
FX.co ★ Actual patterns. Technical analysis and trading recommendations

Technical Analysis Patterns
There is nothing more precious to a trader than an ability to predict a further price movement. Technical analysis is a key to your successful transaction. At the same time, you can rely on common and recurring situations that arise in the same circumstances. Our Technical Analysis Patterns section features all trading recommendations based on the technical analysis patterns that help traders make projections and turn a profit.
Instrument:
All
#Bitcoin
EURCHF
EURGBP
EURJPY
EURUSD
EURCAD
EURRUB
EURNZD
USDCAD
USDCHF
USDJPY
USDRUB
NZDCAD
NZDUSD
NZDCHF
NZDJPY
AUDCAD
AUDCHF
AUDJPY
AUDUSD
GBPUSD
GBPJPY
GBPAUD
GBPCHF
GOLD
SILVER
#AAPL
#AMZN
#EBAY
#FB
#GOOG
#MCD
#MA
#KO
#INTC
#MSFT
#NTDOY
#PEP
#TSLA
#TWTR
Figure:
All
Triangle
Rectangle
Pennant
Flag
Head and Shoulders
Double Top
Triple top
Timeframe:
All
M5
M15
M30
H1
D1
Signal strength:
All
High
Medium
Low
Signal direction:
All
Buy
Sell
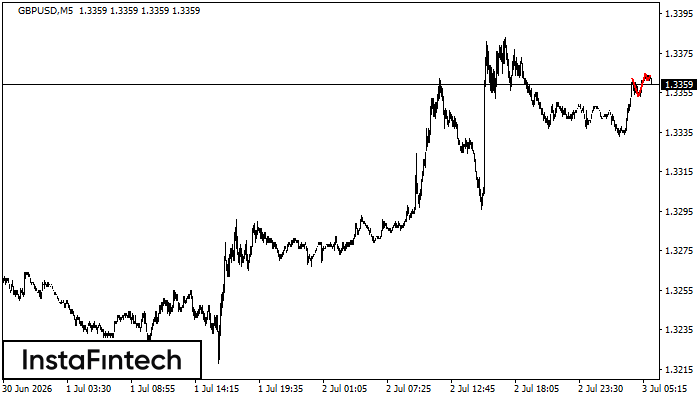
GBPUSD M5
Triple Top
The Triple Top pattern has formed on the chart of the GBPUSD M5. Features of the pattern: borders have an ascending angle; the lower line of the pattern has the coordinates 1.3353/1.3361 with the upper limit 1.3362/1.3364; the projection of the width is 9 points. The formation of the Triple Top figure most likely indicates a change in the trend from upward to downward. This means that in the event of a breakdown of the support level of 1.3353, the price is most likely to continue the downward movement.
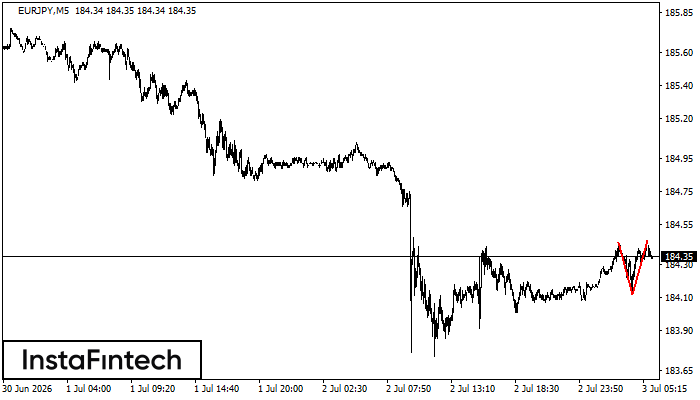
EURJPY M5
Double Top
The Double Top pattern has been formed on EURJPY M5. It signals that the trend has been changed from upwards to downwards. Probably, if the base of the pattern 184.12 is broken, the downward movement will continue.
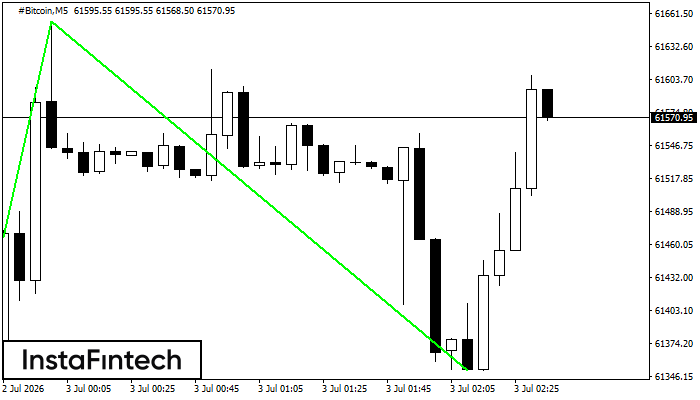
#Bitcoin M5
Double Bottom
The Double Bottom pattern has been formed on #Bitcoin M5; the upper boundary is 61654.19; the lower boundary is 61351.20. The width of the pattern is 31381 points. In case of a break of the upper boundary 61654.19, a change in the trend can be predicted where the width of the pattern will coincide with the distance to a possible take profit level.
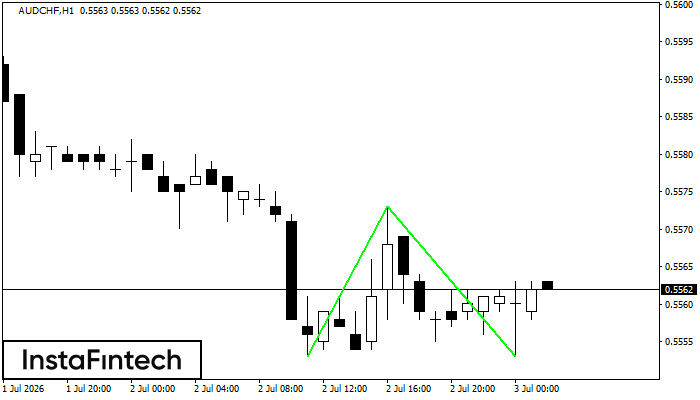
AUDCHF H1
Double Bottom
The Double Bottom pattern has been formed on AUDCHF H1. Characteristics: the support level 0.5553; the resistance level 0.5573; the width of the pattern 20 points. If the resistance level is broken, a change in the trend can be predicted with the first target point lying at the distance of 20 points.
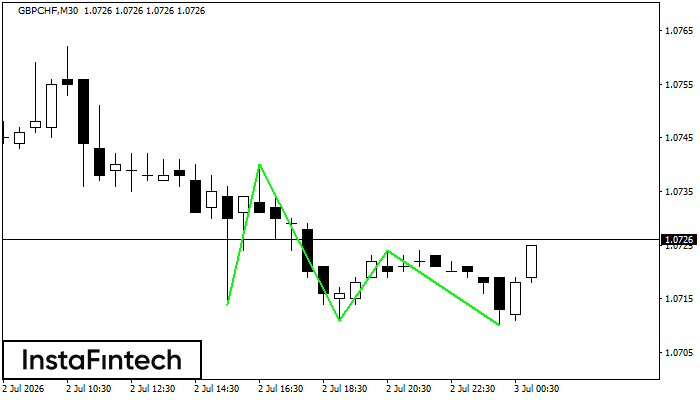
GBPCHF M30
Triple Bottom
The Triple Bottom pattern has been formed on GBPCHF M30. It has the following characteristics: resistance level 1.0740/1.0724; support level 1.0714/1.0710; the width is 26 points. In the event of a breakdown of the resistance level of 1.0740, the price is likely to continue an upward movement at least to 1.0741.
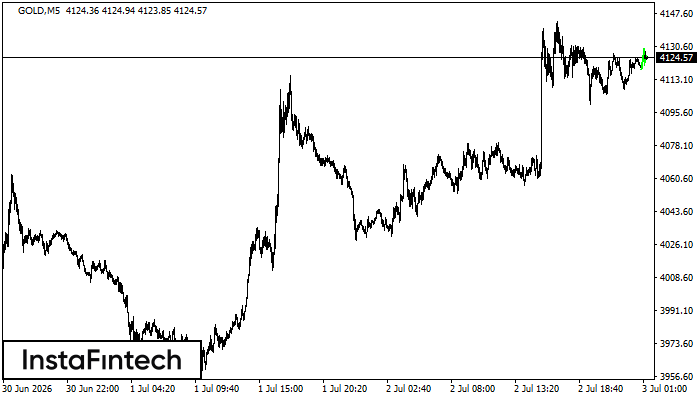
GOLD M5
Bullish pennant
The Bullish pennant pattern is formed on the GOLD M5 chart. It is a type of the continuation pattern. Supposedly, in case the price is fixed above the pennant’s high of 4129.14, a further uptrend is possible.
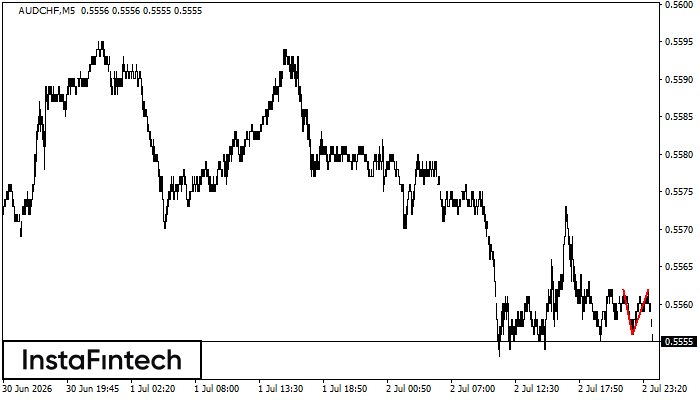
AUDCHF M5
Double Top
On the chart of AUDCHF M5 the Double Top reversal pattern has been formed. Characteristics: the upper boundary 0.5562; the lower boundary 0.5556; the width of the pattern 6 points. The signal: a break of the lower boundary will cause continuation of the downward trend targeting the 0.5541 level.
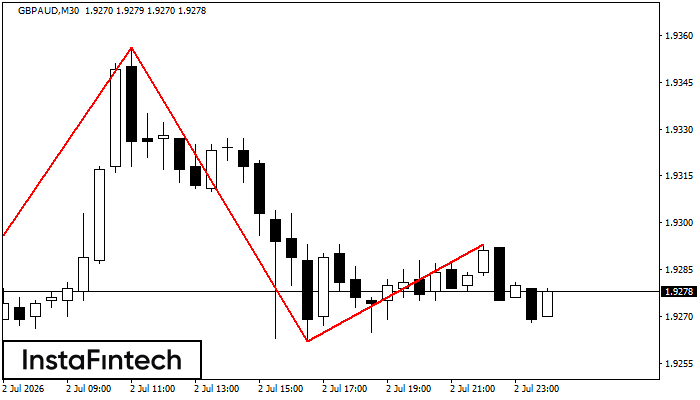
GBPAUD M30
Head and Shoulders
According to the chart of M30, GBPAUD formed the Head and Shoulders pattern. The Head’s top is set at 1.9356 while the median line of the Neck is found at 1.9251/1.9262. The formation of the Head and Shoulders pattern evidently signals a reversal of the upward trend. In other words, in case the scenario comes true, the price of GBPAUD will go towards 1.9232.
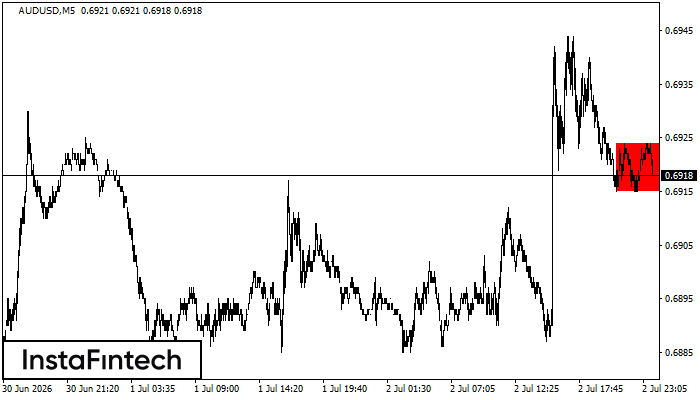
AUDUSD M5
Bearish Rectangle
According to the chart of M5, AUDUSD formed the Bearish Rectangle. This type of a pattern indicates a trend continuation. It consists of two levels: resistance 0.6924 - 0.0000 and support 0.6915 – 0.6915. In case the resistance level 0.6915 - 0.6915 is broken, the instrument is likely to follow the bearish trend.
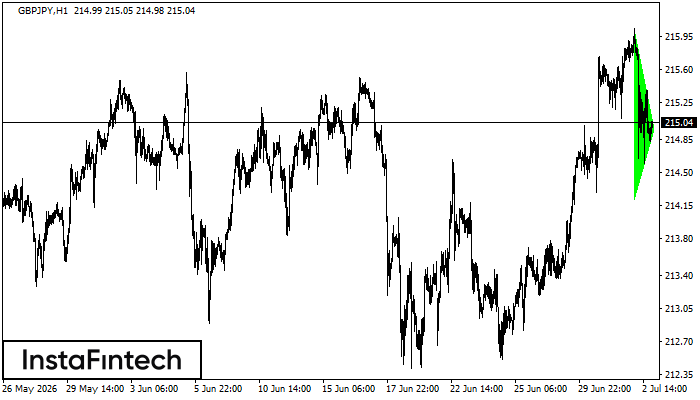
GBPJPY H1
Bullish Symmetrical Triangle
According to the chart of H1, GBPJPY formed the Bullish Symmetrical Triangle pattern. The lower border of the pattern touches the coordinates 214.22/214.96 whereas the upper border goes across 216.04/214.96. If the Bullish Symmetrical Triangle pattern is in progress, this evidently signals a further upward trend. In other words, in case the scenario comes true, the price of GBPJPY will breach the upper border to head for 215.36.