 English
  Русский
 Bahasa Indonesia
 Bahasa Malay
 ไทย
ไทย Español
 Deutsch
 Български
 Français
 Tiếng Việt
 中文
中文 বাংলা
বাংলা हिन्दी
 Čeština
 Українська
 Română

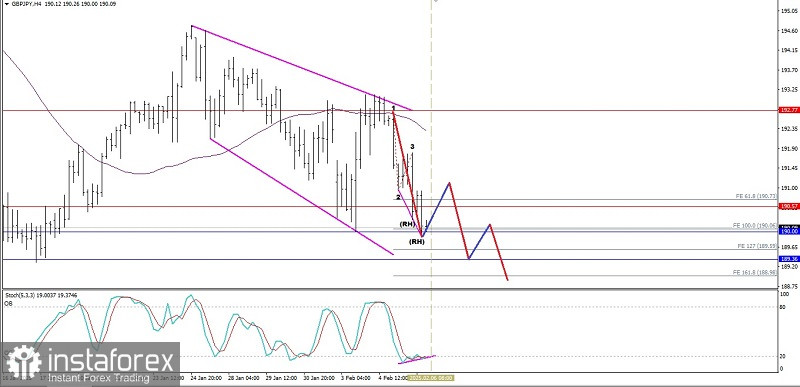
On the 4-hour chart, the GBP/JPY cross currency pair appears to be moving below the MA (50) which has a downward slope and is also confirmed by the appearance of the Bearish 123 pattern followed by 2 bearish Ross Hook (RH) so that based on these facts in the near future GBP/JPY has the potential to weaken down where the level of 190,60 will be tested to be broken and close below that level if successful then GBP/JPY has the potential to continue its weakening to the level of 189.59 and 188.98 as the next target if the momentum and volatility of the weakening support but please note that with the appearance of divergence between the GBP/JPY price movement and the Stochastic Oscillator indicator and the detection of the emergence of the Descending Broadening Wedge pattern, there is a chance that GBP/JPY will strengthen again but as long as the strengthening does not breaks and close above the level of 191.81 then the strengthening is only a correction.
(Disclaimer)