 English
  Русский
 Bahasa Indonesia
 Bahasa Malay
 ไทย
ไทย Español
 Deutsch
 Български
 Français
 Tiếng Việt
 中文
中文 বাংলা
বাংলা हिन्दी
 Čeština
 Українська
 Română

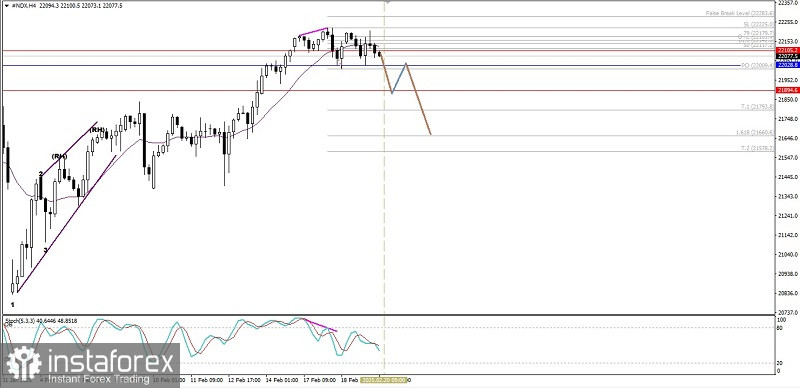
If we look at the 4-hour chart of the Nasdaq 100 index, we will see a Divergence between the price movement of #NDX and the Stochastic Oscillator indicator (5,3,3), especially if it is also confirmed by the price movement that has been below the WMA (21) which has a decreasing slope, then it confirms that in the near future #NDX has the potential to weaken down to the level of 22009.4. If this level is successfully broken and closes below it, then it confirms that the weakening will continue to 21852.5 and 21660.6 if the momentum of the weakening and volatility support it, but if on its way to the target levels, #NDX suddenly turns around and strengthens until it breaks through and closes above 22283.6, then it can be said that the previously described decline setup will be invalid and automatically canceled by itself.
(Disclaimer)