 English
  Русский
 Bahasa Indonesia
 Bahasa Malay
 ไทย
ไทย Español
 Deutsch
 Български
 Français
 Tiếng Việt
 中文
中文 বাংলা
বাংলা हिन्दी
 Čeština
 Українська
 Română

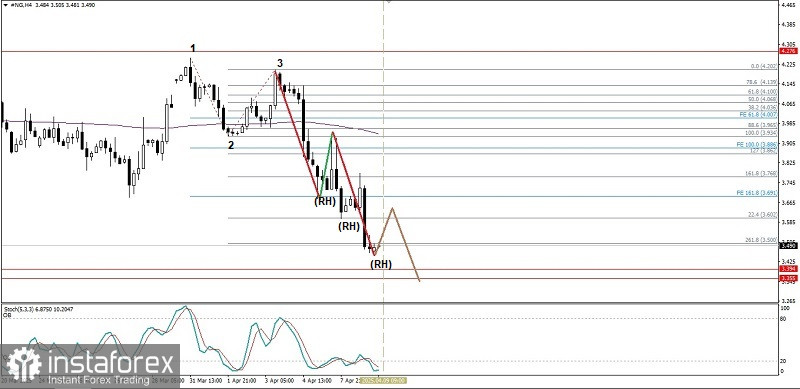
On the 4-hour chart of the Natural Gas commodity instrument, a Bearish 123 pattern appears followed by a Bearish Ross Hook (RH) followed by a Natural Gas price movement below the EMA (200) indicating that Sellers dominate this commodity instrument so that there is a potential for weakening in Natural Gas which will bring #NG to the area level of 3.394-3.355 and if the momentum of the weakening and volatility support it, 3.073 will be the next target, but with the position of the Stochastic Oscillator which is already at the Oversold level, there is also the potential for a strengthening correction, but as long as the strengthening does not break through and close above 3.768, #NG will still be dominated by Sellers.
(Disclaimer)