 English
  Русский
 Bahasa Indonesia
 Bahasa Malay
 ไทย
ไทย Español
 Deutsch
 Български
 Français
 Tiếng Việt
 中文
中文 বাংলা
বাংলা हिन्दी
 Čeština
 Українська
 Română

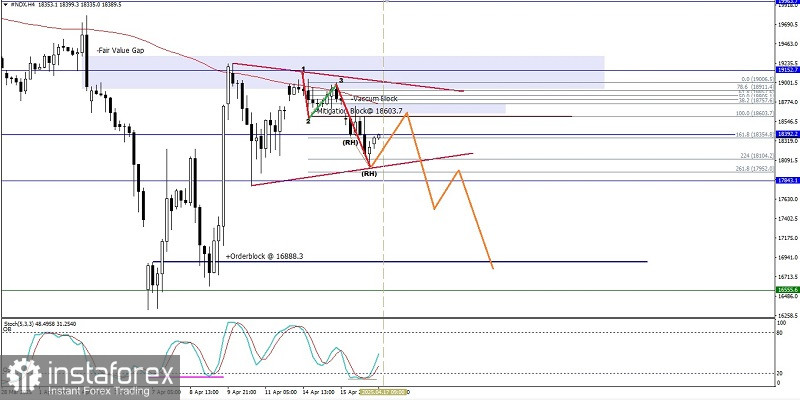
From what we see on the 4-hour chart of the Nasdaq 100 index, there are several interesting things, namely, first, the price movement is moving below the MA (100), second, the appearance of a Triangle pattern, and third, there is a Bearish 123 pattern followed by a Bearish Ross Hook (RH). So that based on these three facts in the near future, it has the potential to weaken down where the level of 17952.0 will be tried to be tested so that if this level is successfully broken and closes below this level, #NDX has the potential to continue its weakening back to the level of 16888.3, however, if in the effort of #NDX to reach the levels that have been described previously suddenly there is a strengthening of #NDX until it breaks through and closes above 19006.5, then all the weakening scenarios that have been described previously will become invalid and canceled by themselves.
(Disclaimer)