 English
  Русский
 Bahasa Indonesia
 Bahasa Malay
 ไทย
ไทย Español
 Deutsch
 Български
 Français
 Tiếng Việt
 中文
中文 বাংলা
বাংলা हिन्दी
 Čeština
 Українська
 Română

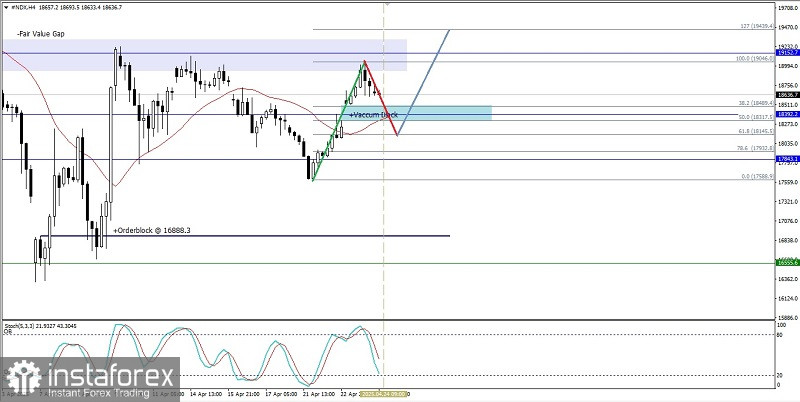
Although on the 4-hour chart the Nasdaq 100 index is Sideways, the range is quite large so that there is still a fairly promising opportunity in the index. Currently the Stochastic Oscillator indicator is in a Crossing SELL condition which indicates that in the near future #NDX has the potential to weaken down to test the Bullish Vacuum Block area level, especially at level 18392.2, but what needs to be considered is that as long as #NDX does not weaken until it breaks through and closes below level 18104.7, the index has the potential to strengthen again to level 19152.7 and if the momentum and volatility support it, 19946.5 will be the next target to be aimed of.
(Disclaimer)