English
  Русский
 Bahasa Indonesia
 Bahasa Malay
 ไทย
ไทย Español
 Deutsch
 Български
 Français
 Tiếng Việt
 中文
中文 বাংলা
বাংলা हिन्दी
 Čeština
 Українська
 Română

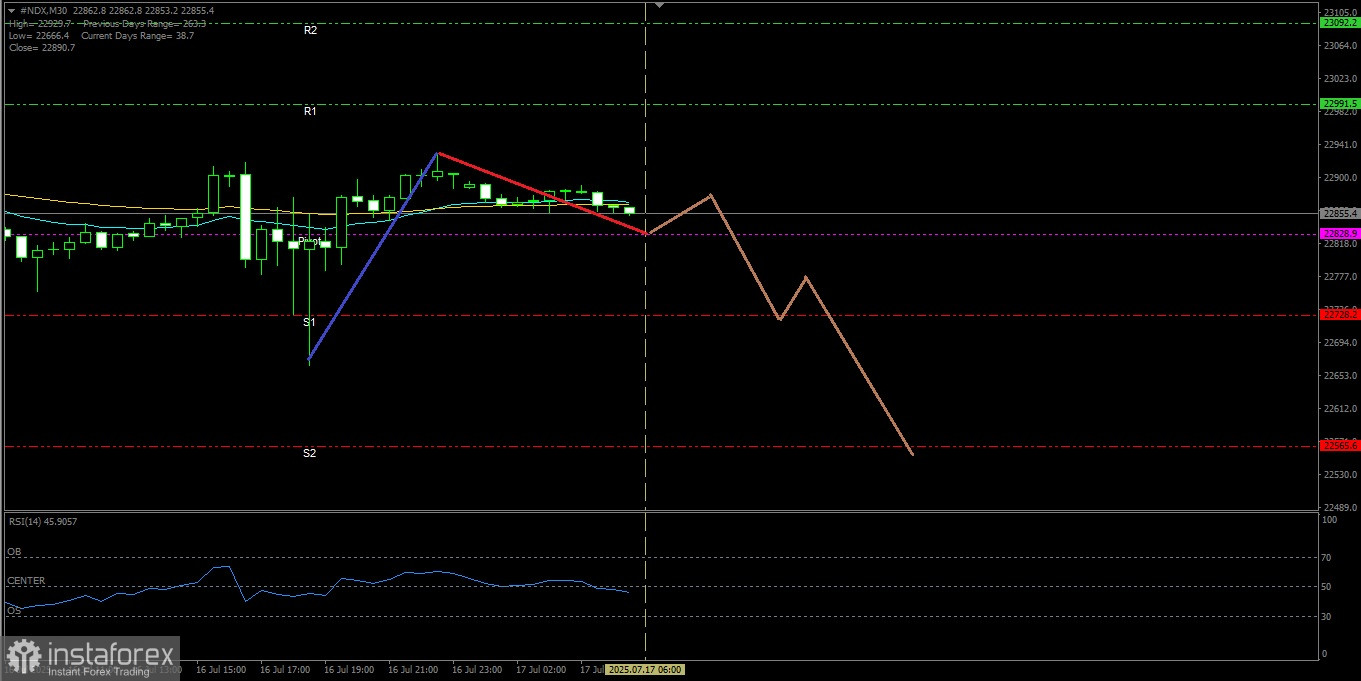
Nasdaq 100 Index - Thursday, July 17, 2025
The #NDX price movement is below the EMA(20) and EMA(50), supported by the RSI(14) at a neutral bearish level. Therefore, the #NDX has the potential to continue weakening in the near term.
Key Levels
1. Resistance 2: 23092.2.
2. Resistance 1: 22991.5.
3. Pivot: 22828.9.
4. Support 1: 22728.2.
5. Support 2: 22565.6.
Tactical Scenario
Pressure Risk Zone: If the price breaks below 22828.9, the #NDX has the potential to continue its decline to 22728.2.
Momentum Extension Bias: If the 22728.2 level is successfully broken and closes below it, the #NDX decline will continue to 22565.6.
Invalidation Level / Bias Revision
The downside bias is invalid if the index successfully breaks through and closes above 23092.2.
Technical Summary
EMA(20): 22869.3.
EMA(50): 22866.3
RSI(14): 45.90.
Economic News Release Agenda:
Earnings uncertainty, pressure from tech/futures stocks, and the Fed drama could put pressure on the Nasdaq 100 index today.
Tonight, there are news releases from the United States:
US Core Retail Sales m/m - 7:30 PM WIB.
US Retail Sales m/m - 7:30 PM WIB.
Unemployment Claims - 7:30 PM WIB.