English
  Русский
 Bahasa Indonesia
 Bahasa Malay
 ไทย
ไทย Español
 Deutsch
 Български
 Français
 Tiếng Việt
 中文
中文 বাংলা
বাংলা हिन्दी
 Čeština
 Українська
 Română

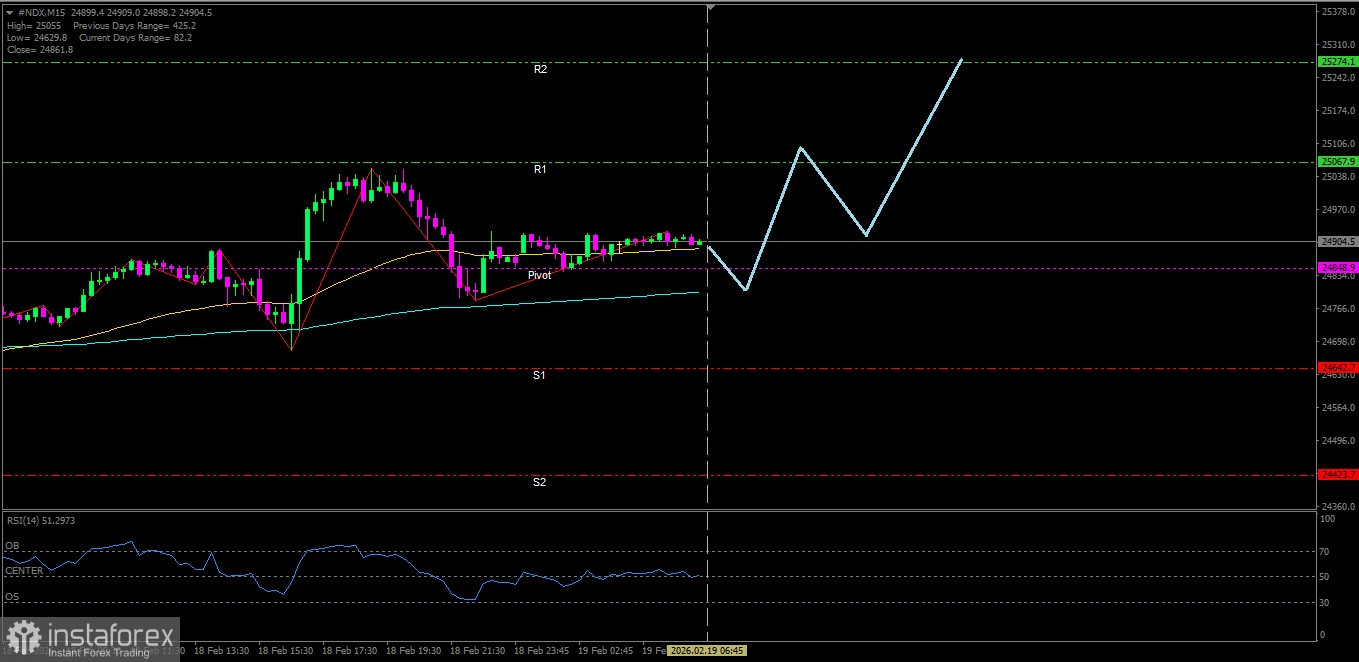
[Nasdaq 100 Index]
Although RSI(14) is in the Neutral-Bearish level, but with both EMAs forming a Golden Cross intersection, it appears that #NDX has the potential to resume its upside.
Key Levels
1. Resistance. 2 : 25274.1
2. Resistance. 1 : 25067.9
3. Pivot : 24848.9
4. Support. 1 : 24642.7
5. Support. 2 : 24423.7
Tactical Scenario
Positive Reaction Zone: If the price holds at 24848.9, there is a possibility the move will rise toward 25067.9.
Momentum Extension Bias: If 25067.9 is broken, the strengthening could continue to 25274.1.
Invalidation Level / Bias Revision
The upside bias weakens if #NDX falls and breaks below 24423.7.
Technical Summary
EMA(50) : 24889.8
EMA(200): 24800.3
RSI(14) : 49.85
Economic News Release Agenda:
Tonight the United States will release the following economic data:
US - Unemployment Claims - 20:30 WIB
US - Philly Fed Manufacturing Index - 20:30 WIB
US - Goods Trade Balance - 20:30 WIB
US - Prelim Wholesale Inventories m/m - 20:30 WIB
US - Trade Balance - 20:30 WIB
US - Pending Home Sales m/m - 22;00 WIB
US - CB Leading Index m/m - 22:00 WIB
US - Natural Gas Storage - 22:30 WIB
US - Crude Oil Inventories - 00:00 WIB