English
  Русский
 Bahasa Indonesia
 Bahasa Malay
 ไทย
ไทย Español
 Deutsch
 Български
 Français
 Tiếng Việt
 中文
中文 বাংলা
বাংলা हिन्दी
 Čeština
 Українська
 Română

[GOLD]
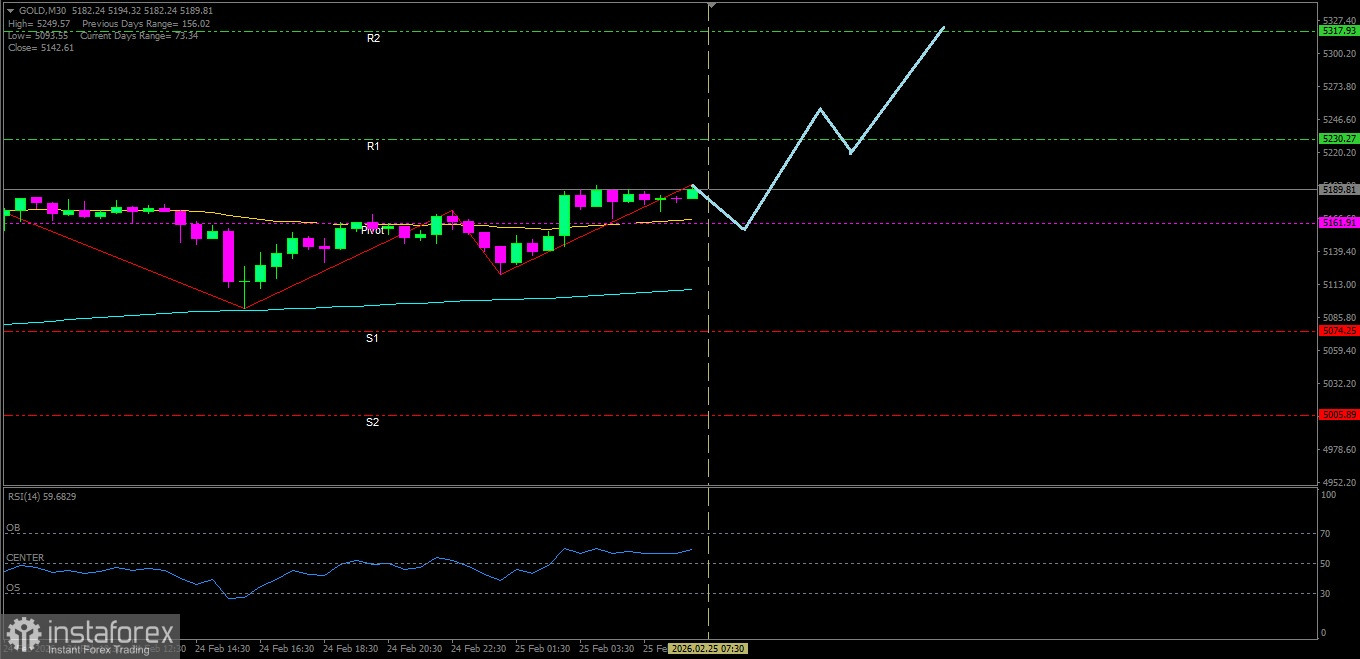
Gold has the potential to continue its strengthening today toward the nearest resistance level, as confirmed by supporting technical indicators.
Key Levels
1. Resistance. 2 : 5317.93
2. Resistance. 1 : 5230.27
3. Pivot : 5161.91
4. Support. 1 : 5074.25
5. Support. 2 : 5005.89
Tactical Scenario
Positive Reaction Zone: If Gold breaks above 5161.91, the move may continue up toward 5230.27.
Momentum Extension Bias: If 5230.27 is broken, 5317.93 could be tested.
Invalidation Level / Bias Revision
The upside bias weakens if Gold falls and closes below 5005.89.
Technical Summary
EMA(50) : 5165.75
EMA(200): 5108.69
RSI(14) : 61.35
Economic News Release Agenda:
Tonight the United States will release Crude Oil Inventories at 22:30 WIB.