English
  Русский
 Bahasa Indonesia
 Bahasa Malay
 ไทย
ไทย Español
 Deutsch
 Български
 Français
 Tiếng Việt
 中文
中文 বাংলা
বাংলা हिन्दी
 Čeština
 Українська
 Română

Gold
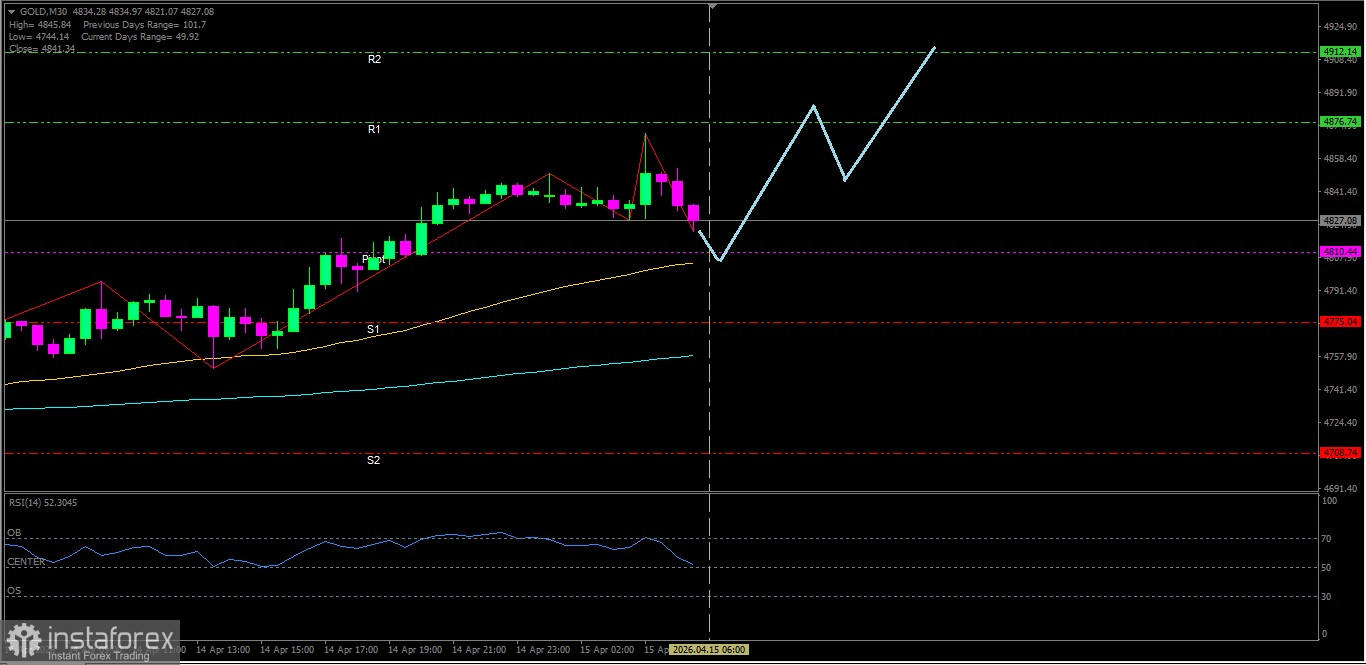
With RSI(14) condition in the Neutral-Bullish area and EMA(50) as well as EMA(200) which forming a Golden Cross, Gold has the potential today to strengthen toward its nearest resistance level.
Key Levels
1. Resistance. 2 : 4912.14
2. Resistance. 1 : 4876.74
3. Pivot : 4810.44
4. Support. 1 : 4775.04
5. Support. 2 : 4708.74
Tactical Scenario
Positive Reaction Zone: If the price breaks above 4876.74, there is a likelihood Gold will move up toward 4912.14.
Momentum Extension Bias: If 4912.14 is also broken, Gold could test 4978.44.
Invalidation Level / Bias Revision
The upside bias weakens if Gold falls below 4708.74.
Technical Summary
EMA(50) : 4804.41
EMA(200): 4757.75
RSI(14) : 57.20
Economic News Release Agenda:
Today the United States will release the following economic data:
US - Empire State Manufacturing Index - 19:30
US - Import Prices m/m - 19:30
US - NAHB Housing Market Index - 21:00
US - Crude Oil Inventories - 21:30
US - Beige Book - 01:00
US - TIC Long-Term Purchases - 03:00