English
  Русский
 Bahasa Indonesia
 Bahasa Malay
 ไทย
ไทย Español
 Deutsch
 Български
 Français
 Tiếng Việt
 中文
中文 বাংলা
বাংলা हिन्दी
 Čeština
 Українська
 Română

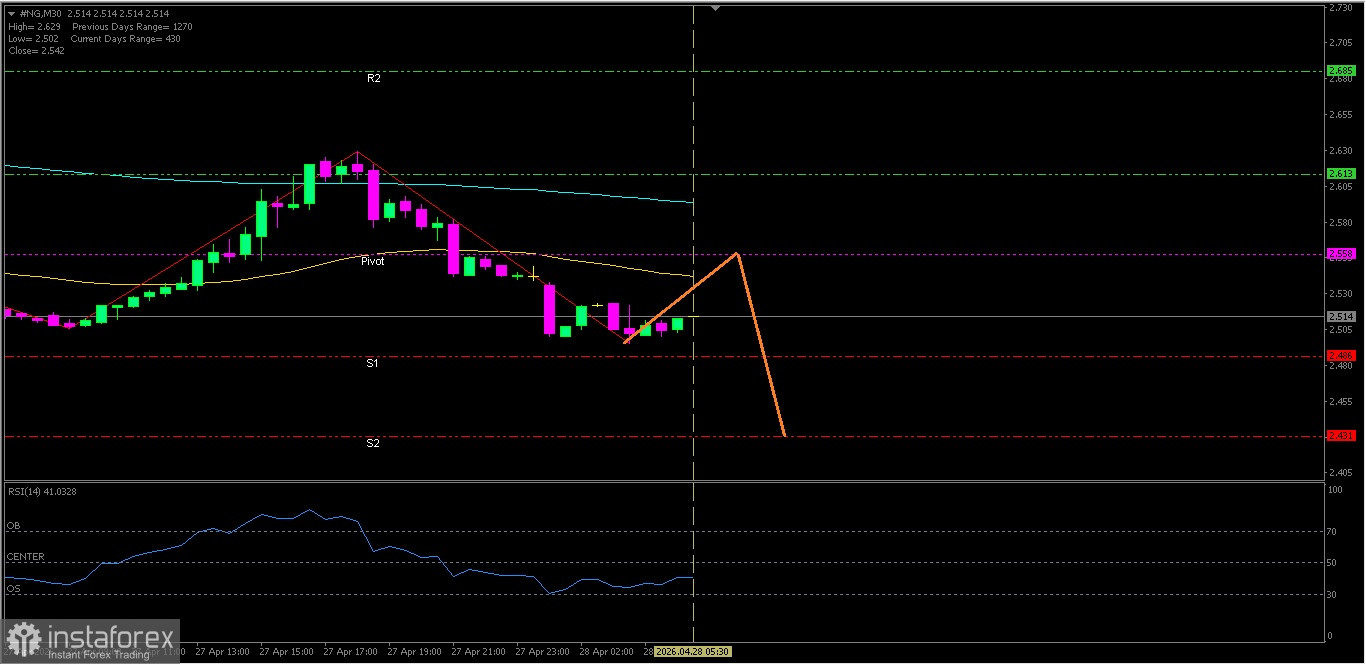
Natural Gas
With all technical conditions supporting weakness in #NG, then in the near term Natural Gas has the potential to test its nearest support level.
Key Levels
1. Resistance. 2 : 2.685
2. Resistance. 1 : 2.613
3. Pivot : 2.558
4. Support. 1 : 2.486
5. Support. 2 : 2.431
Tactical Scenario
Pressure Zone: If the price breaks down below 2.486, there is potential for continued pressure toward 2.431.
Momentum Extension Bias: If 2.431 is broken to the downside, there is potential for the weakening to continue to 2.359.
Invalidation Level / Bias Revision
The downside bias is restrained if the price strengthens and breaks above 2.685.
Technical Summary
EMA(50) : 2.543
EMA(200): 2.594
RSI(14) : 40.54
Economic News Release Agenda:
Today the United States will release the following economic data:
US - ADP Weekly Employment Change - 19:15 WIB
US - HPI m/m - 20:00 WIB
US - S&P/CS Composite-20 HPI y/y - 20:00 WIB
US - CB Consumer Confidence - 21:00 WIB
US - Richmond Manufacturing Index - 21:00 WIB
US - API Weekly Statistical Bulletin - 03:30 WIB