English
  Русский
 Bahasa Indonesia
 Bahasa Malay
 ไทย
ไทย Español
 Deutsch
 Български
 Français
 Tiếng Việt
 中文
中文 বাংলা
বাংলা हिन्दी
 Čeština
 Українська
 Română

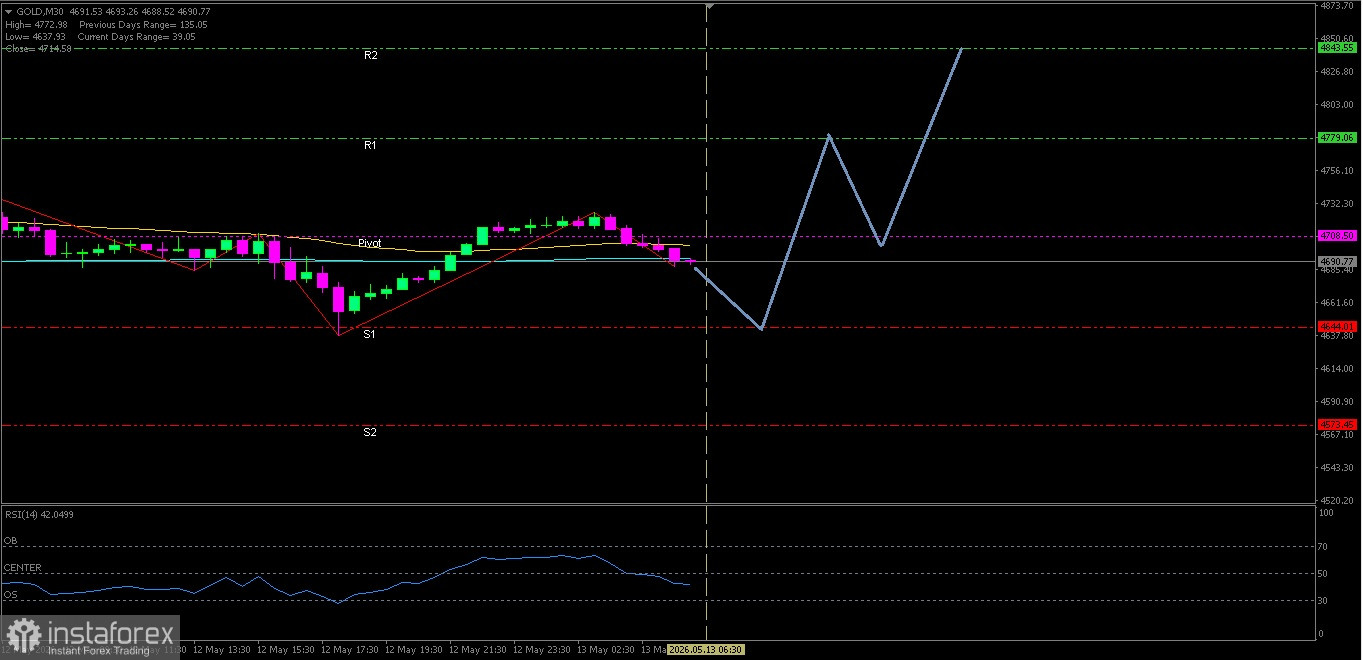
GOLD
Although the condition of Gold is still moving in a ranging pattern, but it has the potential to test its nearest resistance level, as confirmed by both EMAs which is forming a Golden Cross.
Key Levels
1. Resistance. 2 : 4843.55
2. Resistance. 1 : 4779.06
3. Pivot : 4708.50
4. Support. 1 : 4644.01
5. Support. 2 : 4573.45
Tactical Scenario
Positive Reaction Zone: If the price holds at 4708.50, there is a likelihood of a move up toward 4779.06.
Momentum Extension Bias: If 4779.06 is broken, 4843.55 becomes the next target.
Invalidation Level / Bias Revision
The upside bias weakens if Gold falls below 4573.45.
Technical Summary
EMA(50) : 4702.90
EMA(200): 4693.23
RSI(14) : 42.50
Economic News Release Agenda:
Tonight the United States will release the following economic data:
US - Core PPI m/m - 19:30 WIB
US - PPI m/m -19:30 WIB
US - Crude Oil Inventories - 21:30 WIB
US - 30-y Bond Auction - 00:01 WIB