 English
  Русский
 Bahasa Indonesia
 Bahasa Malay
 ไทย
ไทย Español
 Deutsch
 Български
 Français
 Tiếng Việt
 中文
中文 বাংলা
বাংলা हिन्दी
 Čeština
 Українська
 Română

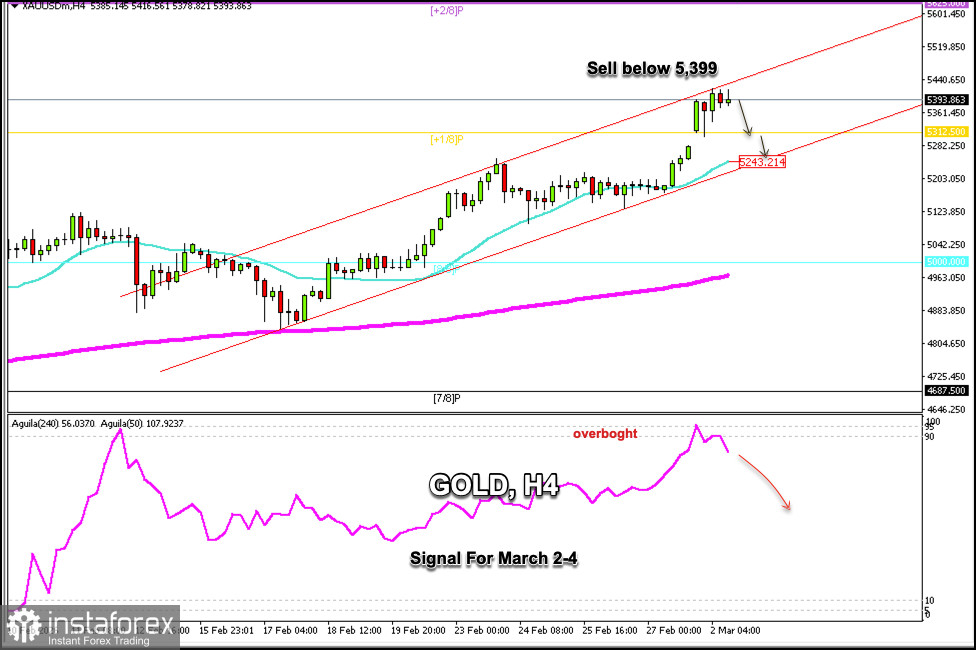
Gold is trading around $5,393, up +1/8 Murray and within the uptrend channel formed since February 17 with a bullish bias.
On the H4 chart, we can see that gold attempted to break through the strong resistance of the upper band of the uptrend channel around $5,420 during the European session.
According to the H4 chart, gold is showing signs of exhaustion in its bullish momentum. The formation of Japanese candlesticks on the 4-hour chart suggests that a technical reversal could follow.
A decline could happen in the coming hours towards the +1/8 Murray located at $5,312. Gold could even reach the lower band of the uptrend channel, which, in turn, coincides with the 21 SMA located at $5,243.
Gold left a gap around $5,275, which means that if it falls below $5,300, we could expect it to cover this gap. Therefore, the instrument could resume its upward cycle.
The Eagle indicator has reached extremely overbought levels, so a technical correction towards $5,243 is expected in the coming days.
A sharp break below the uptrend channel and a consolidation below $5,240 could be seen as a clear signal to sell gold with targets at the psychological level of $5,000 and even at the 200 EMA around $4,960.