 English
  Русский
 Bahasa Indonesia
 Bahasa Malay
 ไทย
ไทย Español
 Deutsch
 Български
 Français
 Tiếng Việt
 中文
中文 বাংলা
বাংলা हिन्दी
 Čeština
 Українська
 Română

The EUR/USD currency pair rose by 80 pips on Monday, even before the start of the U.S. trading session. Over the weekend, we mentioned that Monday could be a highly volatile day, as the market would likely react to events from Friday that it hadn't had the chance to respond to. Recall that the press conference between Donald Trump and Volodymyr Zelensky ended in scandal. We won't delve into who instigated the scandal or why it happened, but it seems that Trump is once again employing his usual strategies to achieve his goals.
The core issue revolved around Trump's accusations against Ukraine regarding corruption and the misuse of funds that the U.S. had provided over the past three years. He asserted that Ukraine supposedly owes the U.S. a $500 billion debt, despite the most optimistic estimates not even reaching $200 billion. Trump further issued an ultimatum to Kyiv: in exchange for natural resources, the U.S. would provide security guarantees, peace negotiations, funding, and an end to the war.
However, during the press conference, Zelensky stated that the current version of the agreement contained no security guarantees and was merely a trade deal, with Ukraine selling its natural resources to the U.S. for a share of the profits. This raises the question: why did Zelensky even travel to Washington if the agreement did not include any security assurances?
One way or another, we expected a new "storm," and it happened. The market decided it had had enough of Trump's antics and stopped buying the dollar on every news event that only worsened U.S. relations with its partners. As a result, on Monday, the U.S. dollar collapsed. If we analyze the situation, what changed on Friday? There was no deal before, and no deal was signed. So, fundamentally, nothing changed.
The euro also received a boost from manufacturing PMI indexes in Germany and the EU, which came in higher than expected, and the February inflation report, which showed a year-on-year increase of 2.4% instead of the forecasted 2.3%. These factors supported the euro because higher business activity is good for the European economy, and higher inflation raises hopes for a softer monetary policy stance from the European Central Bank.
However, we still believe that the rise of the euro is not fundamentally sustainable. Yes, Monday's news supported the euro, but what about Tuesday? Has the European economy recovered? No. Has Trump abandoned the idea of imposing tariffs on the EU? No. Has the euro exited its sideways channel on the daily timeframe? No. Will the ECB cancel its expected rate cut on Thursday? No. We saw an unexpected rally but nothing more. The main threat to the dollar remains Donald Trump, but as of now, nothing catastrophic has happened to the U.S. currency, and the correction on the daily timeframe could continue for several more months.
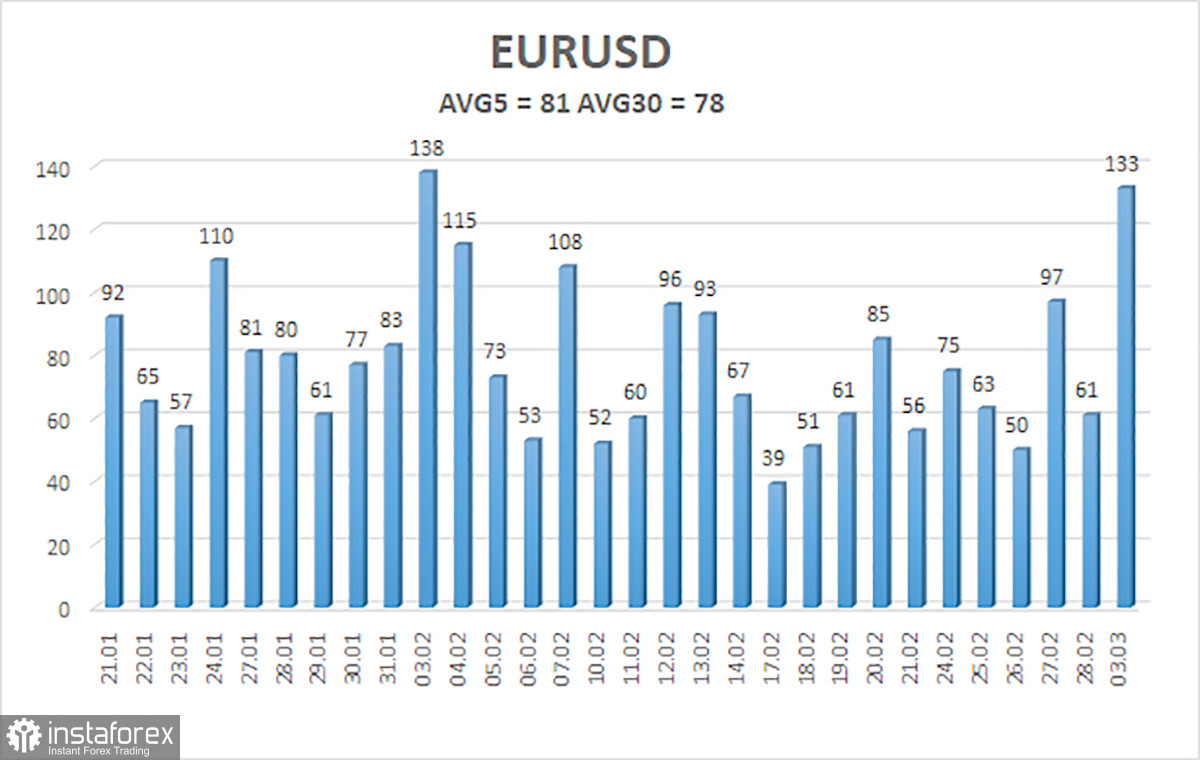
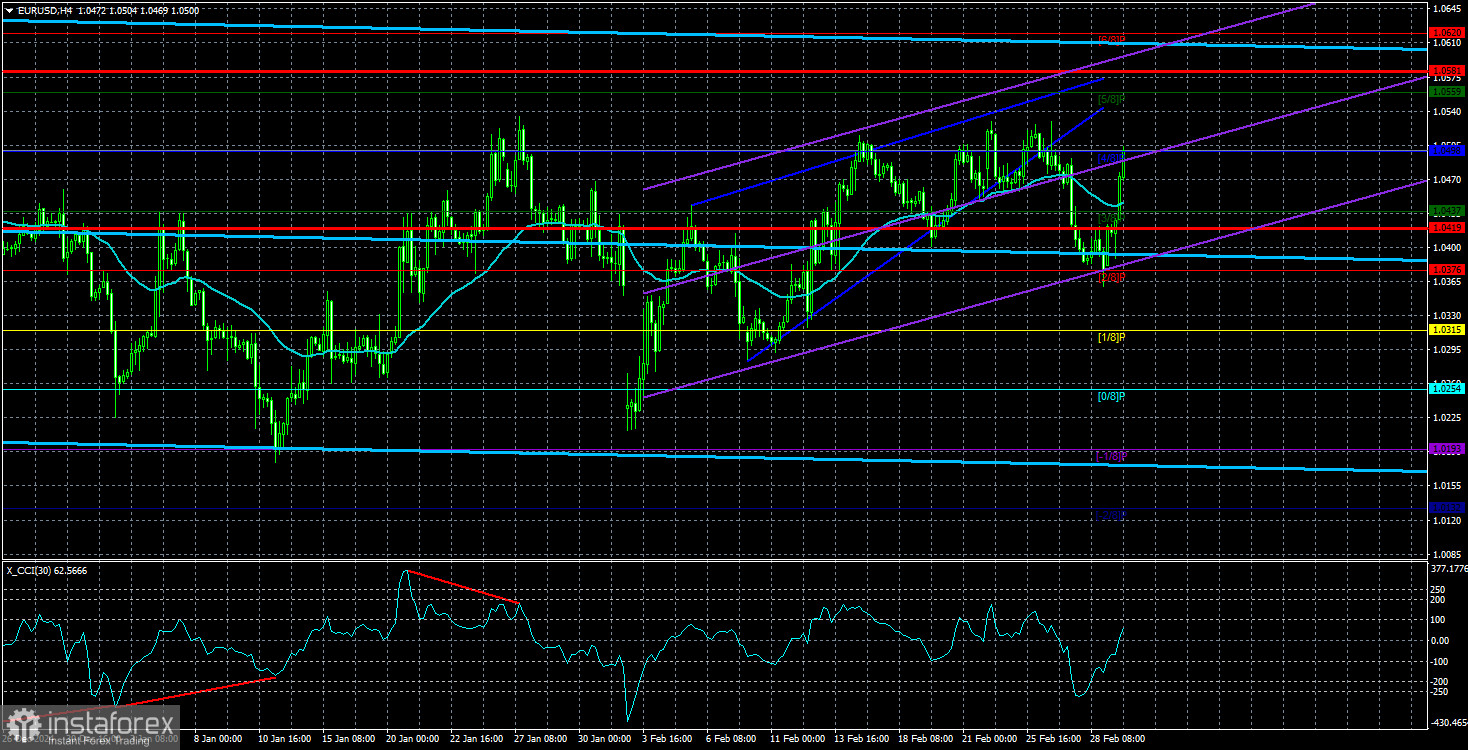
The average volatility of the EUR/USD currency pair over the last five trading days as of March 4 is 81 pips, which is classified as "moderate." On Tuesday, we expect the pair to move between 1.0419 and 1.0581. The long-term regression channel remains downward, and even if it turns upward, the broader downtrend will not be canceled. The CCI indicator has again entered the oversold zone, but this doesn't mean much since the pair remains flat on the daily timeframe.
Nearest Support Levels:
S1 – 1.0437
S2 – 1.0376
S3 – 1.0315
Nearest Resistance Levels:
R1 – 1.0498
R2 – 1.0559
R3 – 1.0620
Trading Recommendations:
The EUR/USD pair continues to trade within the sideways range of 1.0220 – 1.0520. In recent months, we have consistently said that we expect the euro to decline in the medium term, and at this point, nothing has changed. Aside from Donald Trump, the dollar still has no fundamental reasons for a medium-term decline. Short positions remain much more attractive, with initial targets at 1.0315 and 1.0254. If you trade purely on technical analysis, long positions could be considered if the price moves above the moving average, with targets at 1.0498 and 1.0559. However, as we can see, the price has not even managed to break out of its sideways range on the daily timeframe. Any rally is still classified as a correction on the daily timeframe.
Explanation of Illustrations:
Linear Regression Channels help determine the current trend. If both channels are aligned, it indicates a strong trend.
Moving Average Line (settings: 20,0, smoothed) defines the short-term trend and guides the trading direction.
Murray Levels act as target levels for movements and corrections.
Volatility Levels (red lines) represent the likely price range for the pair over the next 24 hours based on current volatility readings.
CCI Indicator: If it enters the oversold region (below -250) or overbought region (above +250), it signals an impending trend reversal in the opposite direction.