 English
  Русский
 Bahasa Indonesia
 Bahasa Malay
 ไทย
ไทย Español
 Deutsch
 Български
 Français
 Tiếng Việt
 中文
中文 বাংলা
বাংলা हिन्दी
 Čeština
 Українська
 Română

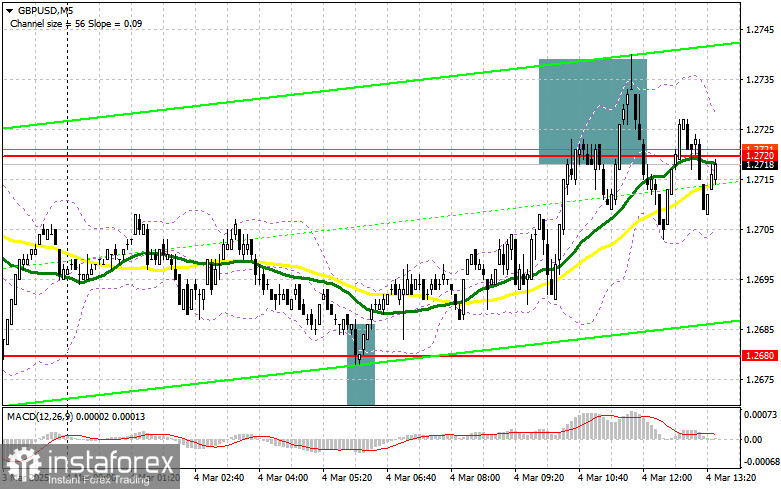
In my morning forecast, I highlighted the 1.2680 level as a key decision point for entering the market. Let's analyze the 5-minute chart to see what happened. A decline followed by a false breakout near 1.2680 created an excellent buying opportunity, leading to a 40-point increase in the pair. The technical outlook has been revised for the second half of the day.
Opening Long Positions on GBP/USD:
As expected, with no significant U.K. economic data, the pound continued to gain strength. This trend may persist in the second half of the day, as even strong U.S. data on the RCM/TIPP Economic Optimism Index is unlikely to disrupt GBP/USD's upward momentum. Additionally, a speech by FOMC member John Williams may favor the British pound.
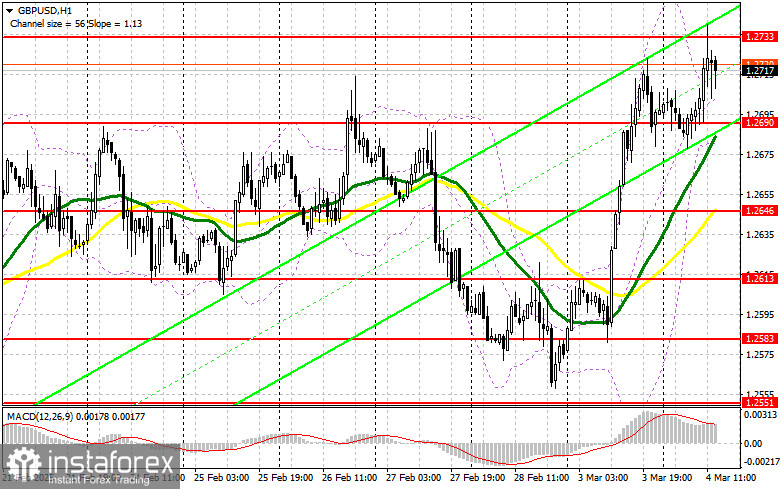
If GBP/USD undergoes a downward correction, I will look to buy near 1.2690, which formed as support during the first half of the day. A false breakout at this level will provide an ideal buying opportunity, targeting a rise toward resistance at 1.2733. A breakout and retest from above will confirm the correct buy entry, opening the way toward 1.2774, reinforcing the bullish market. The final target will be 1.2808, where I plan to take profit.
If GBP/USD declines and buyers fail to defend 1.2690, bearish pressure on the pound will increase significantly. In this case, I will only consider buying after a false breakout at 1.2646. If the pair drops further, I will open long positions from 1.2613, expecting an intraday correction of 30-35 points.
Opening Short Positions on GBP/USD:
Sellers attempted to push the pair lower, but failed to trigger a deeper correction from the monthly high. Currently, the focus is on defending the 1.2733 resistance level, and only a hawkish stance from the Federal Reserve can revive bearish momentum.
The main task for sellers is to protect the 1.2733 resistance, which formed during the first half of the day. A false breakout at this level will provide an entry point for short positions, targeting a decline toward 1.2690. A break below 1.2690, followed by a retest from below, will clear stop orders, opening the path toward 1.2646, where the moving averages (MAs) currently favor buyers. The final downside target will be 1.2613, where I will take profit.
If GBP demand remains strong in the second half of the day, and sellers fail to act near 1.2733, the pair will likely continue rising. In this case, I will delay short entries until the 1.2774 resistance test. I will sell only after a failed breakout attempt at this level. If the pair remains strong and does not reverse at 1.2774, I will look for short entries at 1.2808, targeting a 30-35 point downward correction.
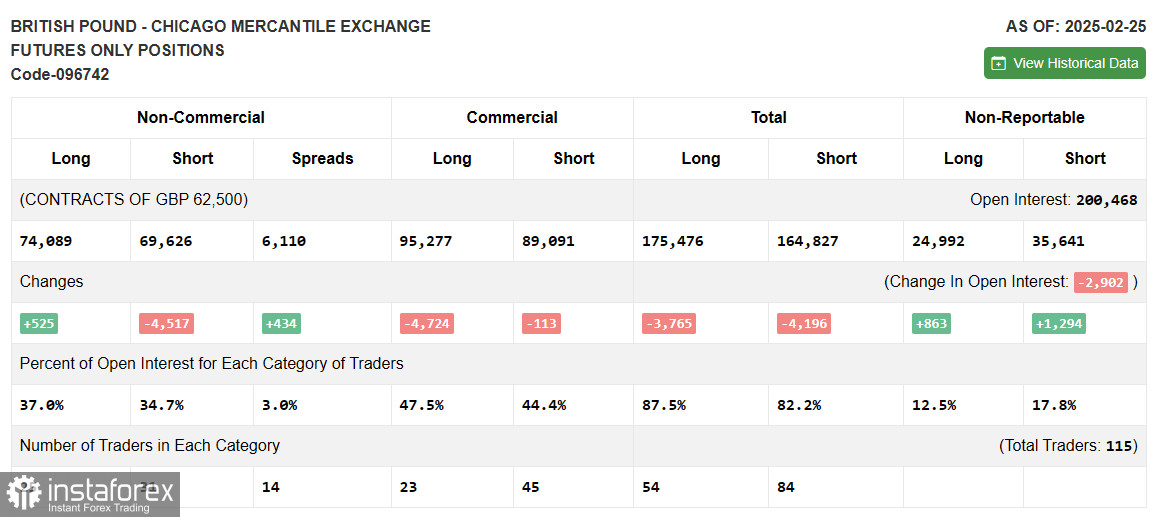
Commitment of Traders (COT) Report:
The COT report for February 25 showed a slight increase in long positions and a reduction in short positions, confirming that buyers are gaining a stronger advantage over sellers. This suggests further GBP/USD growth is likely. The positive developments surrounding the Ukraine conflict and moderate UK economic data continue to support interest in the British pound.
The latest COT report indicated that long non-commercial positions increased by 525, reaching 74,089, while short non-commercial positions decreased by 4,517, falling to 69,626. As a result, the gap between long and short positions expanded by 434.
Indicator Signals
Moving Averages
GBP/USD is trading above the 30- and 50-period moving averages, signaling continued bullish momentum.
Bollinger Bands
If the pair declines, 1.2690 will act as the lower boundary support of the Bollinger Bands indicator.
Indicator Descriptions:
- Moving Average (MA) – identifies the current trend by smoothing out market volatility and noise. Period – 50 (marked in yellow on the chart).
- Moving Average (MA) – identifies the current trend by smoothing out market volatility and noise. Period – 30 (marked in green on the chart).
- MACD (Moving Average Convergence/Divergence) – used to identify trend changes and momentum strength. Fast EMA – 12-period, Slow EMA – 26-period, Signal SMA – 9-period.
- Bollinger Bands – used to determine overbought and oversold conditions. Period – 20.
- Non-commercial traders – speculators such as individual traders, hedge funds, and large institutions, who use the futures market for speculative purposes and meet specific trading criteria.
- Long non-commercial positions – the total long positions held by non-commercial traders.
- Short non-commercial positions – the total short positions held by non-commercial traders.
- Net non-commercial position – the difference between short and long positions held by non-commercial traders.