 English
  Русский
 Bahasa Indonesia
 Bahasa Malay
 ไทย
ไทย Español
 Deutsch
 Български
 Français
 Tiếng Việt
 中文
中文 বাংলা
বাংলা हिन्दी
 Čeština
 Українська
 Română

The EUR/USD pair broke above the 1.0526–1.0535 resistance zone on Tuesday and continued its upward movement. Last night, the 127.2% Fibonacci level at 1.0622 was tested. As of now, there has been no rejection from this level, and a consolidation above it would support further growth toward the next correction level, 161.8% Fibonacci at 1.0734.
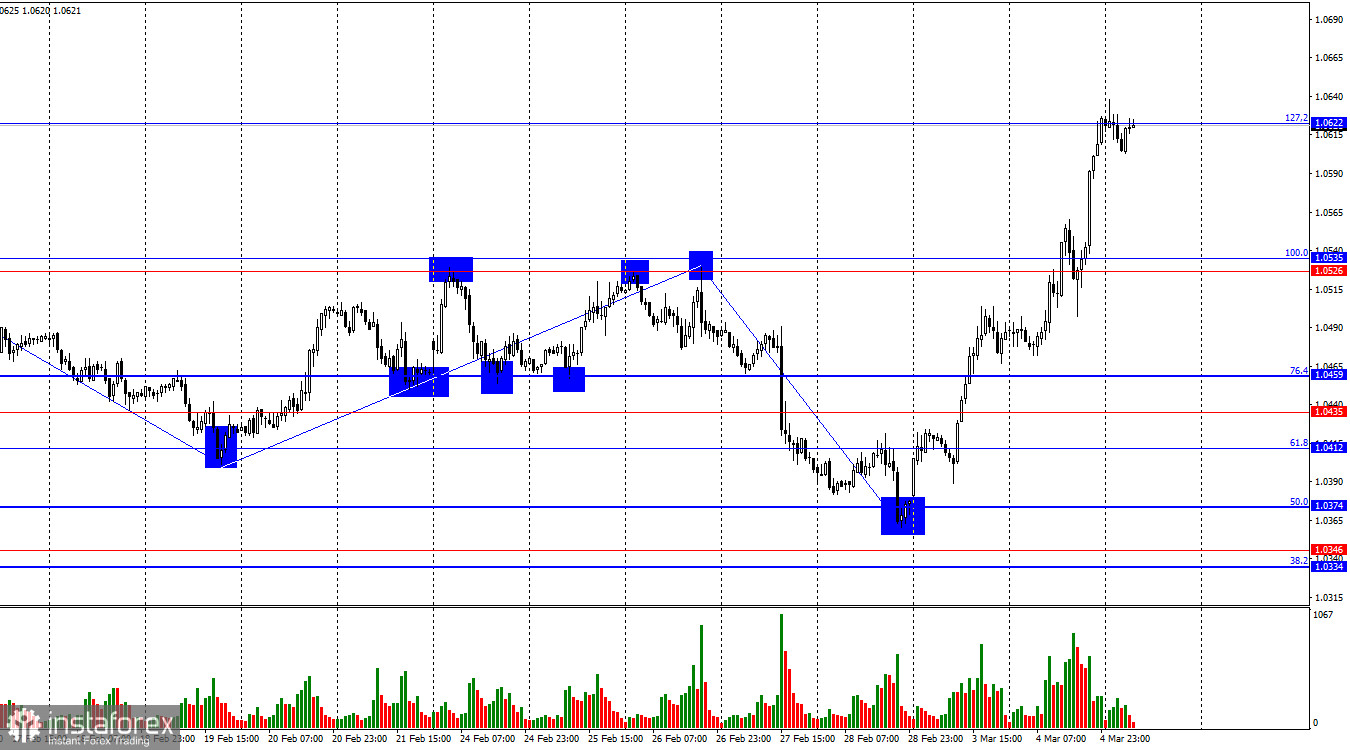
The wave structure on the hourly chart is evolving. The last completed downward wave broke below the previous low, while the new upward wave has surpassed the last peak. This means the market is no longer in a sideways range—instead, waves are now forming a bullish trend. However, the price was range-bound for a long time, with alternating waves, making the current structure less predictable.
The information background on Tuesday provided no positive signals for the U.S. dollar. The primary issue is not recent economic data or the Federal Open Market Committee's (FOMC) softening stance on monetary policy, but rather Donald Trump's foreign policy agenda aimed at restoring what he perceives as fairness for the U.S. Trump's definition of fairness currently involves imposing tariffs on Mexico, China, Canada, the EU, and the UK. The first three nations have already felt the effects of U.S. import duties. However, traders are not just concerned about tariffs—they fear a U.S. economic recession.
Forecasts suggest that U.S. GDP will contract by at least 1% in Q1. As a result, the Fed may resume monetary easing, even though inflation has remained stable in recent months. While I don't believe the Fed will aggressively cut rates in 2025, the market could see more than just the two expected rate cuts. The risk of economic contraction due to tariffs is a strong reason for selling the U.S. dollar. Traders are preparing for the worst, and they have every reason to do so.
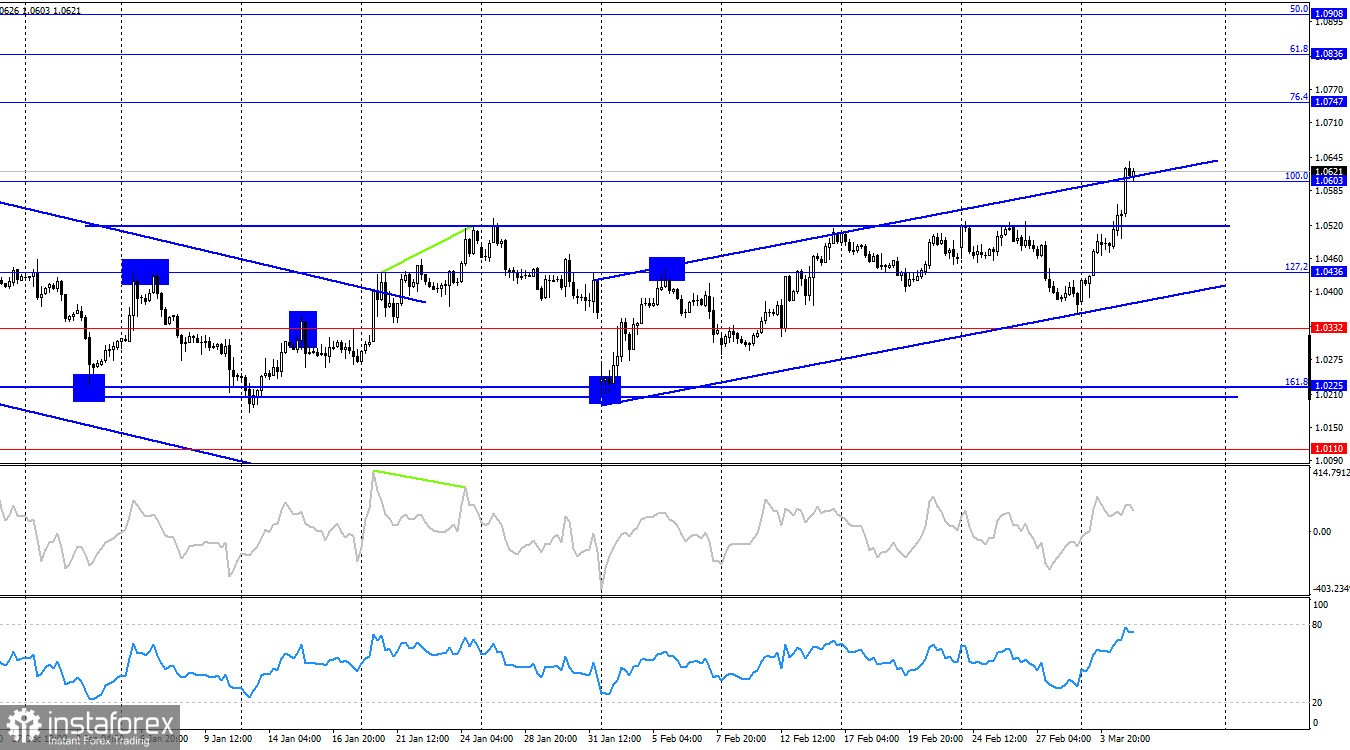
On the 4-hour chart, the pair has broken above the previous horizontal range, confirming a bullish trend, as indicated by the ascending trend channel. A consolidation above the 100.0% Fibonacci level at 1.0603 supports continued euro growth toward the next correction level, 76.4% Fibonacci at 1.0747. No new divergences are forming today. The euro's rally is largely fueled by U.S. political developments, but this week still holds significant economic data releases that could influence market direction.
Commitments of Traders (COT) Report
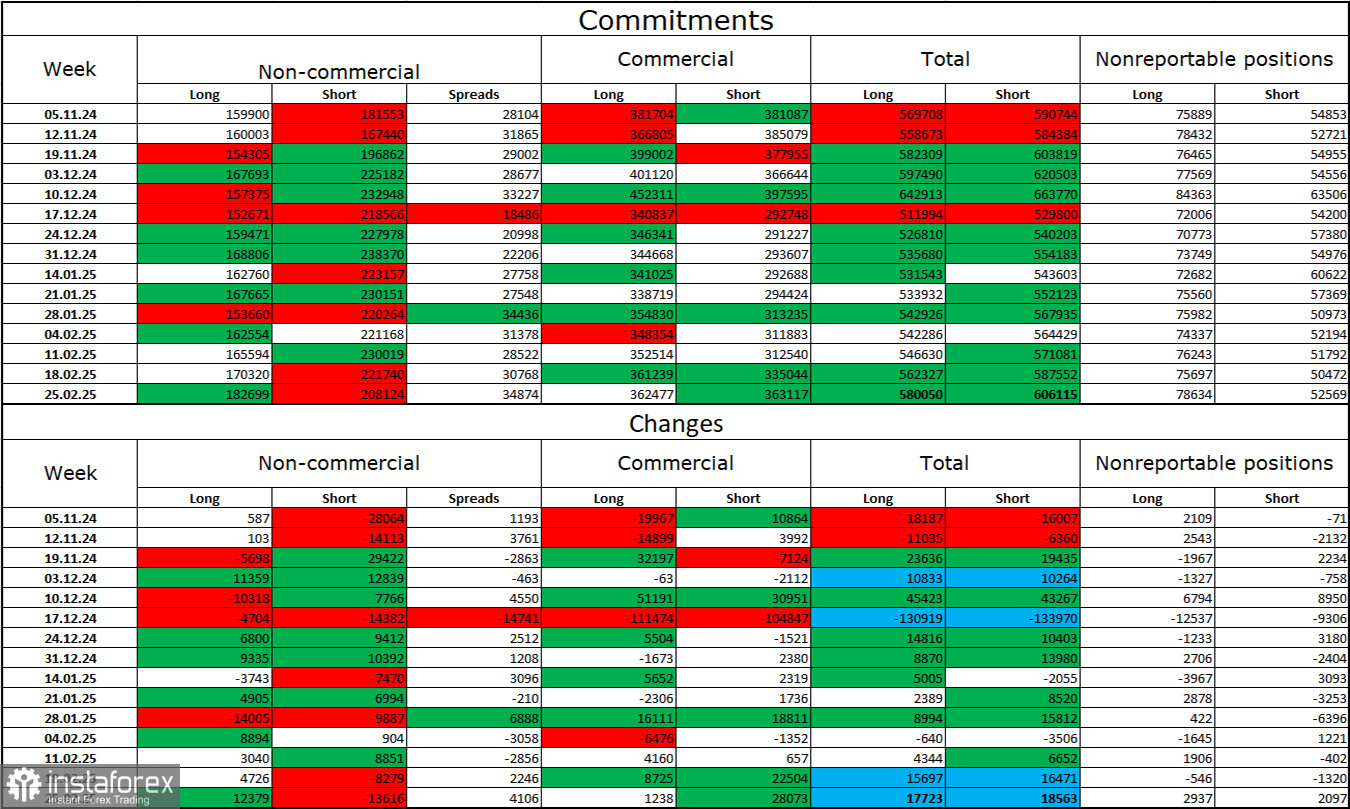
During the latest reporting week, institutional traders opened 12,379 long positions and closed 13,616 short positions. The Non-Commercial category remains bearish, but sentiment has been weakening in recent weeks. The total long positions among speculators now stand at 182,000, while short positions total 208,000.
For 20 consecutive weeks, major players have been reducing euro positions, reinforcing a bearish trend. Occasionally, bulls dominate within individual weeks, but this remains an exception rather than a trend shift. The diverging monetary policy outlooks of the ECB and the Fed continue to favor the U.S. dollar. While bearish sentiment is weakening, it is too early to declare an end to the downtrend. Notably, long positions have been increasing for four consecutive weeks, signaling a potential shift in market sentiment.
Key Economic Events – Eurozone & U.S. (March 5)
- Germany – Services PMI (08:55 UTC)
- Eurozone – Services PMI (09:00 UTC)
- U.S. – ADP Employment Change (13:15 UTC)
- U.S. – Services PMI (14:45 UTC)
- U.S. – ISM Services PMI (15:00 UTC)
The economic calendar for March 5 contains four key data releases, meaning moderate market impact is expected throughout the trading day.
EUR/USD Trading Strategy and Forecast
Short positions were previously valid on a rejection from the 1.0526–1.0529 zone, targeting 1.0458, which has already been achieved. New short positions can be considered if the pair fails to hold above the 1.0622 level on the hourly chart. Long positions may be possible, but the strong, uninterrupted bullish rally is concerning—a sudden reversal could be just as sharp.
Fibonacci Levels
- Hourly Chart: 1.0529–1.0213
- 4-Hour Chart: 1.0603–1.1214