 English
  Русский
 Bahasa Indonesia
 Bahasa Malay
 ไทย
ไทย Español
 Deutsch
 Български
 Français
 Tiếng Việt
 中文
中文 বাংলা
বাংলা हिन्दी
 Čeština
 Українська
 Română

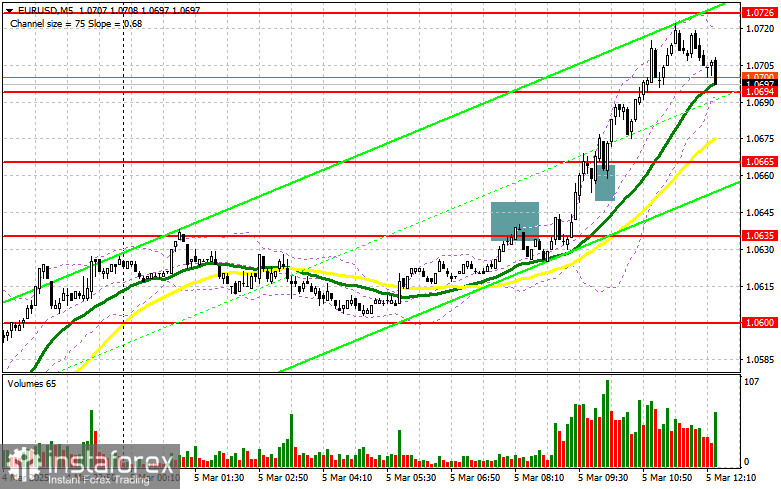
In my morning forecast, I focused on the 1.0635 level and planned to make trading decisions based on it. Let's look at the 5-minute chart and analyze what happened. A rise and false breakout at this level provided a short-selling opportunity, which resulted in only a 10-point drop before the euro resumed its upward movement. A break and retest of 1.0665 created a buying opportunity, pushing the pair up to 1.0720. The technical outlook for the second half of the day has been adjusted.
Long Position Strategy for EUR/USD
Despite rather weak service sector data from the Eurozone, the euro continued to rise, gaining over 100 points from the opening level. The emergence of Germany's new fiscal policy is prompting euro buyers to bet on economic strengthening and currency appreciation in the near future. Additionally, talks about U.S. interest rate cuts, hinted at by U.S. Treasury Secretary Bessent yesterday, are putting further pressure on the U.S. dollar.
In the second half of the day, key reports such as the ADP employment change for February, ISM Services PMI, and composite PMI index are due for release. If the euro declines, I plan to buy only if the new support at 1.0682 holds, which was established during the first half of the day. A false breakout at this level would provide a strong buy signal, aiming for continued growth toward the 1.0717 resistance, which was already tested during the European session.
A break and retest of this range will confirm a buying opportunity, with the next target at 1.0759. The final bullish target is 1.0795, where I plan to take profits. If EUR/USD drops further and there is no buying interest at 1.0682, demand for the euro will decline slightly, and the pair may consolidate within a new sideways range. Sellers could then push the price toward 1.0641, where I will consider buying only after a false breakout. My last-resort long entry is planned at 1.0603, targeting a 30-35 point intraday rebound.
Short Position Strategy for EUR/USD
Sellers are trying to push the pair lower, but with little success. The key focus now is on defending the 1.0717 resistance, which is crucial for further price action. Only a false breakout at this level would provide an opportunity to enter short positions, targeting a correction toward 1.0682 support.
A break and consolidation below 1.0682, which is only likely if U.S. labor market data exceeds expectations, would create another selling opportunity, targeting 1.0641. The final bearish target is 1.0603, where I will take profit.
If EUR/USD continues rising in the second half of the day, and bears fail to act around 1.0717—which appears likely—buyers could push for another strong rally. In this scenario, I will postpone short positions until the 1.0759 resistance test, where I will sell only after an unsuccessful consolidation. My last-resort short entry is at 1.0795, targeting a 30-35 point downward correction.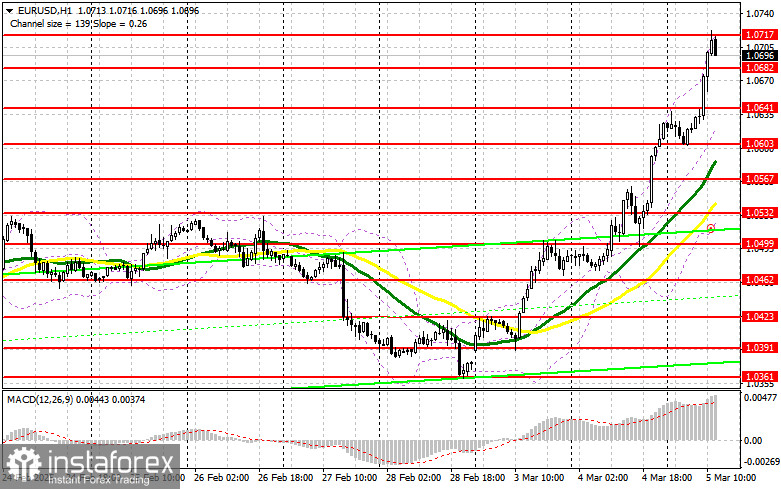
COT (Commitment of Traders) Report Analysis
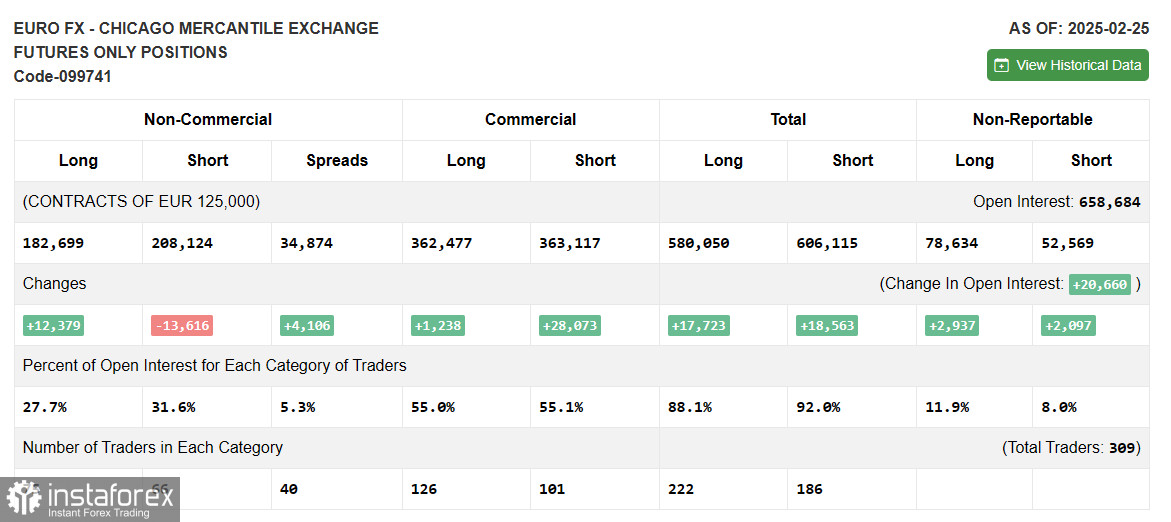
The COT report from February 25 showed an increase in long positions and a sharp decline in short positions, indicating growing demand for the euro. Investors are increasingly buying risk assets, partly due to U.S. pressure on Ukraine to negotiate a ceasefire, as well as Eurozone inflation data, which meets the ECB's expectations. This allows the ECB to proceed with rate cuts, which could benefit the euro in the long run.
However, sellers still maintain an advantage, so caution is advised when buying at highs. According to the COT report, non-commercial long positions increased by 12,379, reaching 182,699, while non-commercial short positions dropped by 13,616, falling to 208,124. As a result, the gap between long and short positions widened by 4,106.
Indicator Signals
Moving Averages
The price remains above the 30 and 50-day moving averages, indicating continued euro strength.
Note: The author uses hourly (H1) moving averages, which may differ from the traditional daily (D1) moving averages.
Bollinger Bands
If the price declines, the lower boundary of the indicator at 1.0532 will act as support.
Indicator Descriptions
- Moving Average (MA): Identifies the current trend by smoothing out volatility and noise.
- 50-period MA (marked in yellow on the chart).
- 30-period MA (marked in green on the chart).
- MACD (Moving Average Convergence/Divergence):
- Fast EMA – 12-period.
- Slow EMA – 26-period.
- SMA – 9-period.
- Bollinger Bands: 20-period.
- Non-commercial traders: Speculators such as individual traders, hedge funds, and large institutions, who use the futures market for speculative purposes and meet specific requirements.
- Long non-commercial positions: The total number of open long positions held by non-commercial traders.
- Short non-commercial positions: The total number of open short positions held by non-commercial traders.
- Net non-commercial position: The difference between short and long positions held by non-commercial traders.