 English
  Русский
 Bahasa Indonesia
 Bahasa Malay
 ไทย
ไทย Español
 Deutsch
 Български
 Français
 Tiếng Việt
 中文
中文 বাংলা
বাংলা हिन्दी
 Čeština
 Українська
 Română

On Wednesday, the EUR/USD pair continued its upward movement, consolidating above the 161.8% Fibonacci retracement level at 1.0734 and breaking through the resistance zone of 1.0781–1.0797. This suggests that the uptrend could extend toward the next Fibonacci level of 200.0% at 1.0857. A consolidation below the 1.0781–1.0797 zone would favor the U.S. dollar and provide hope for at least some corrective decline in the pair.
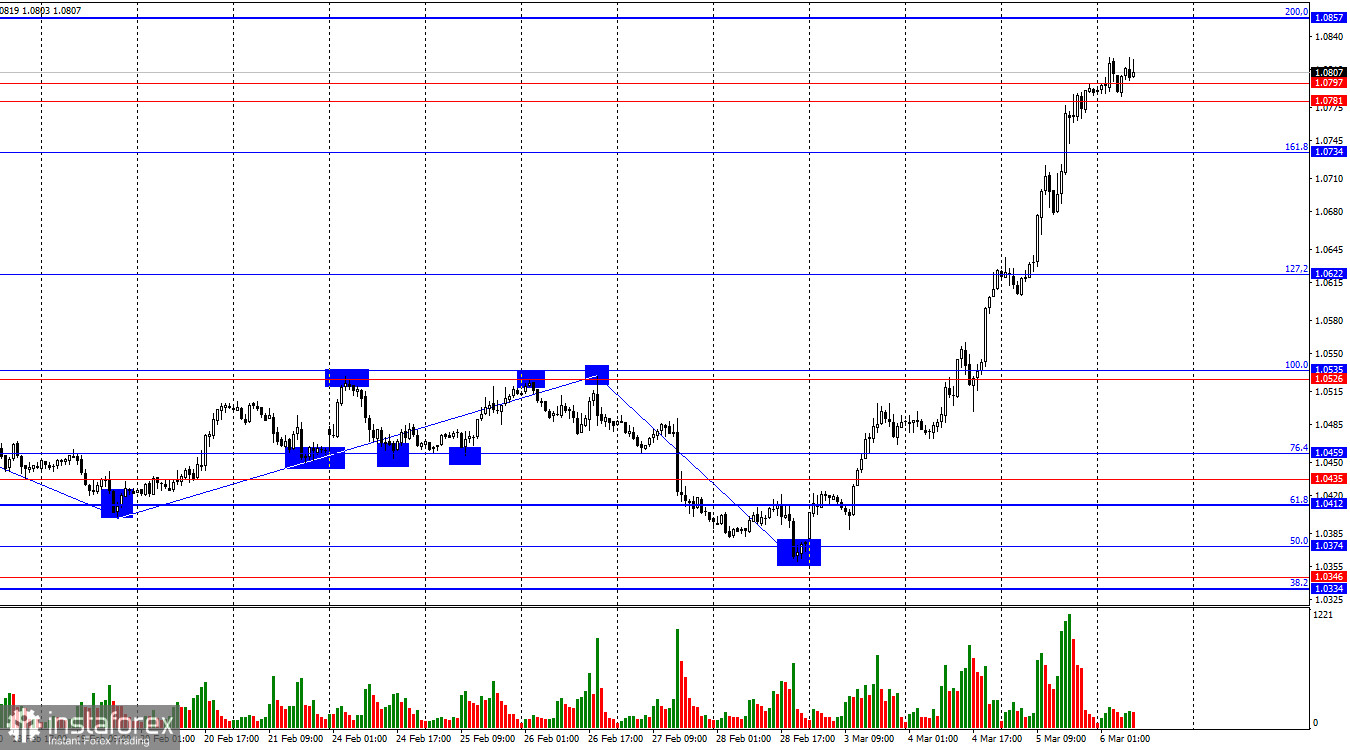
The wave structure on the hourly chart has transformed. The last completed downward wave broke below the previous low, while the new upward wave surpassed the previous peak. This confirms that the market is now in a bullish trend. However, the current rally appears impulsive, driven by fears of an economic slowdown in the U.S. due to measures implemented by Donald Trump.
Wednesday's fundamental backdrop was notably weak. The business activity indices from Germany, the Eurozone, and the U.S. were unlikely to be the catalysts behind another aggressive rally in the euro, which surged by another 170 points. Business activity in the Eurozone's services sector slowed, Germany's services sector also showed a decline, while the ISM Services PMI in the U.S. actually improved. The million-dollar question is: which currency should have strengthened based on this data? Clearly, not the euro.
Today's ECB meeting will likely result in a decision to continue monetary policy easing. Typically, a dovish ECB stance is a bearish factor for the euro. While the market may have already priced in this decision, the fact remains that the euro continues to rise. Is the rally really driven by expectations of ECB rate cuts? At the moment, the market is trading solely on headlines related to Donald Trump. Bulls feel strong support, while any data that contradicts the euro's rise is simply being ignored.
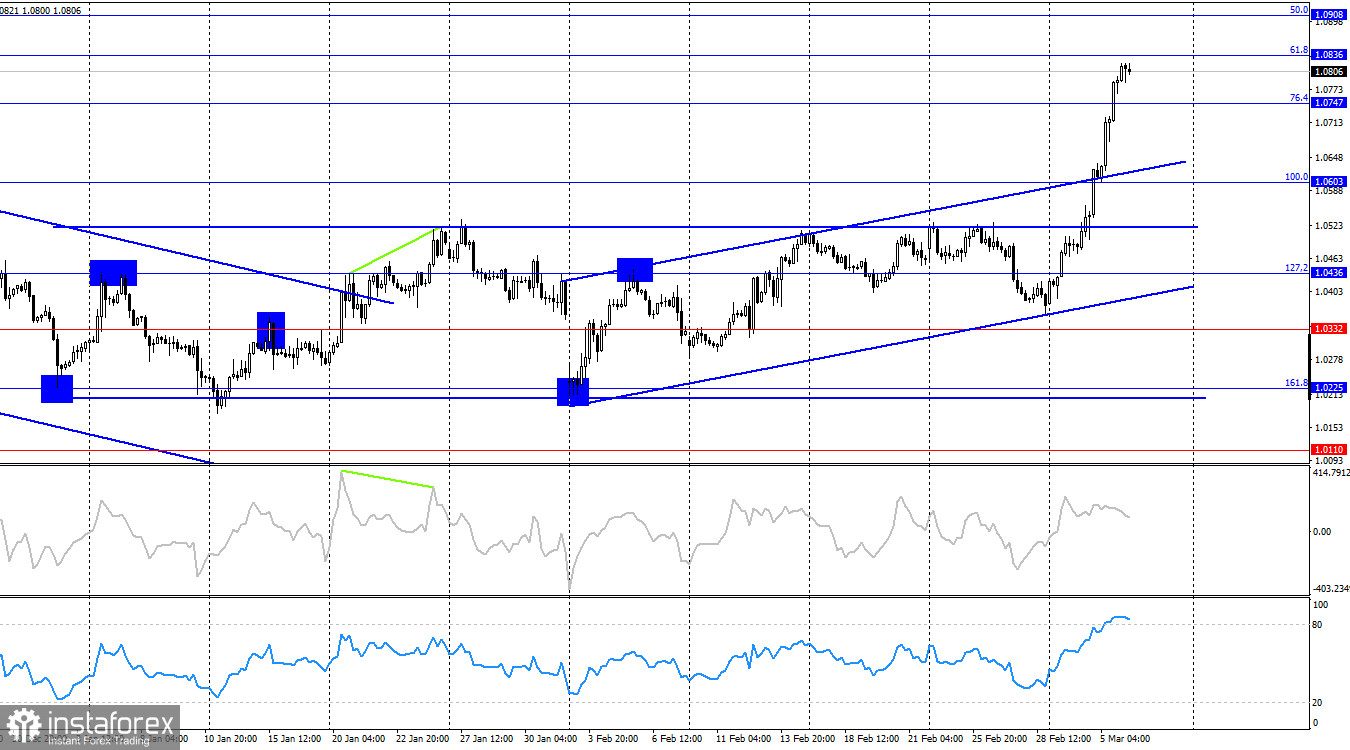
On the 4-hour chart, EUR/USD has broken above its previous consolidation range, reinforcing a bullish trend confirmed by the ascending price channel. The pair is breaking through key levels one after another with no significant pullbacks. No bearish divergences are forming at the moment. While the euro's rally is being fueled by U.S. political developments, the remainder of the week still holds several key economic data releases. There is still a chance for a dollar recovery.
Commitments of Traders (COT) Report
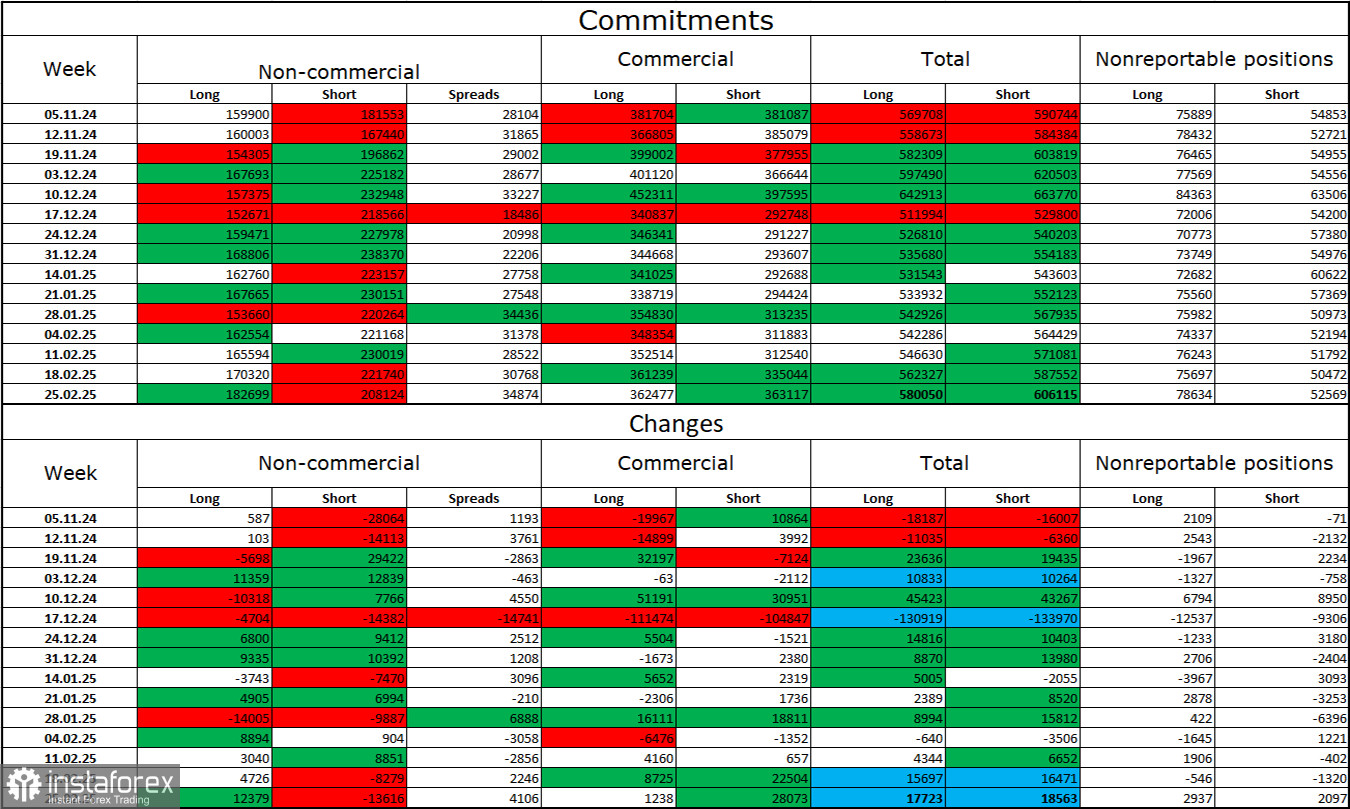
In the latest reporting week, professional traders opened 12,379 new long positions while closing 13,616 short positions. The "Non-commercial" category remains net bearish, but bearish sentiment has been weakening recently. The total number of long positions held by speculators now stands at 182,000, while short positions have decreased to 208,000.
For 20 consecutive weeks, large players have been reducing their euro holdings, reinforcing a clear bearish trend. Occasionally, bullish sentiment prevails for a week or two, but this is more of an exception than the rule. The monetary policy divergence between the ECB and the Fed continues to favor the U.S. dollar, as rate differentials are still expected to widen. While the bearish advantage is starting to weaken, it is too early to declare the end of the downtrend. Long positions have been rising for the past four weeks.
Key Economic Events for the Eurozone and the U.S.:
- Eurozone – Retail Sales (10:00 UTC)
- Eurozone – ECB Interest Rate Decision (13:15 UTC)
- U.S. – Initial Jobless Claims (13:30 UTC)
- Eurozone – ECB Press Conference (13:45 UTC)
On March 6, the economic calendar includes four key releases, with two of them holding significant importance. The impact of these events on market sentiment throughout the day is expected to be moderate.
EUR/USD Forecast and Trading Recommendations:
Selling opportunities will arise if the pair closes below the 1.0781–1.0797 zone on the hourly chart, targeting 1.0734 and 1.0622. Long positions remain an option, but the pair's strong and uninterrupted rally is concerning. A sharp reversal is always a possibility after such a one-sided move.
Fibonacci retracement levels are plotted from 1.0529 to 1.0213 on the hourly chart and from 1.0603 to 1.1214 on the 4-hour chart.