 English
  Русский
 Bahasa Indonesia
 Bahasa Malay
 ไทย
ไทย Español
 Deutsch
 Български
 Français
 Tiếng Việt
 中文
中文 বাংলা
বাংলা हिन्दी
 Čeština
 Українська
 Română

Trend Analysis (Figure 1).
On Wednesday, the market may begin moving downward from the 1.2942 level (previous daily close), targeting 1.2905—the 14.6% retracement level (yellow dashed line). Upon testing this level, the price may rebound upwards, aiming for 1.2977—resistance line (bold blue line).
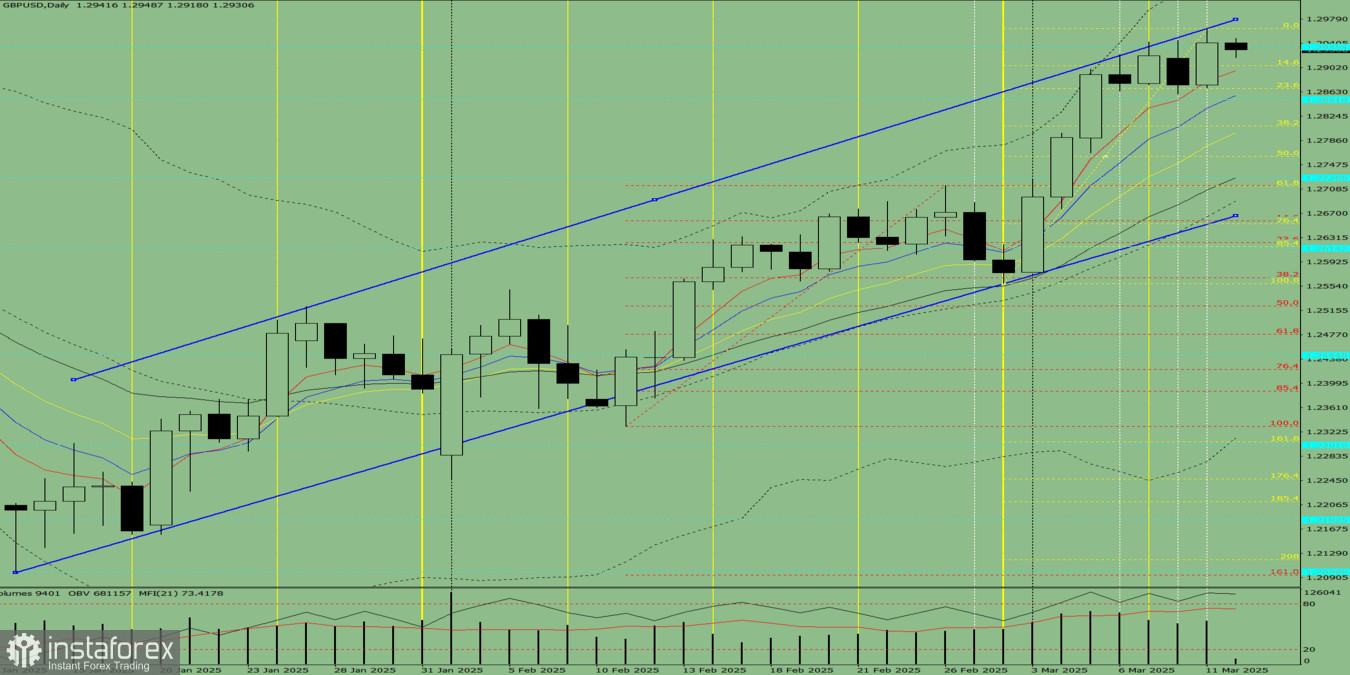
Figure 1 (Daily Chart).
Comprehensive Analysis:
- Indicator analysis – bearish
- Fibonacci levels – bearish
- Volume analysis – bearish
- Candlestick analysis – bearish
- Trend analysis – bearish
- Bollinger Bands – bearish
- Weekly chart – bearish
General Conclusion: Bearish Trend
Alternative Scenario: If the market starts declining from the 1.2942 level, it may target 1.2868 (23.6% retracement level, yellow dashed line). If this level is tested, the price may rebound upwards toward 1.2977—resistance line (bold blue line).