 English
  Русский
 Bahasa Indonesia
 Bahasa Malay
 ไทย
ไทย Español
 Deutsch
 Български
 Français
 Tiếng Việt
 中文
中文 বাংলা
বাংলা हिन्दी
 Čeština
 Українська
 Română

Trend Analysis (Fig. 1):
On Thursday, the market may start moving downward from the 1.2959 level (yesterday's daily close) toward 1.2924 – the 14.6% retracement level (yellow dashed line). From this level, the price might rebound upwards toward 1.2988 – the upper fractal (blue dashed line).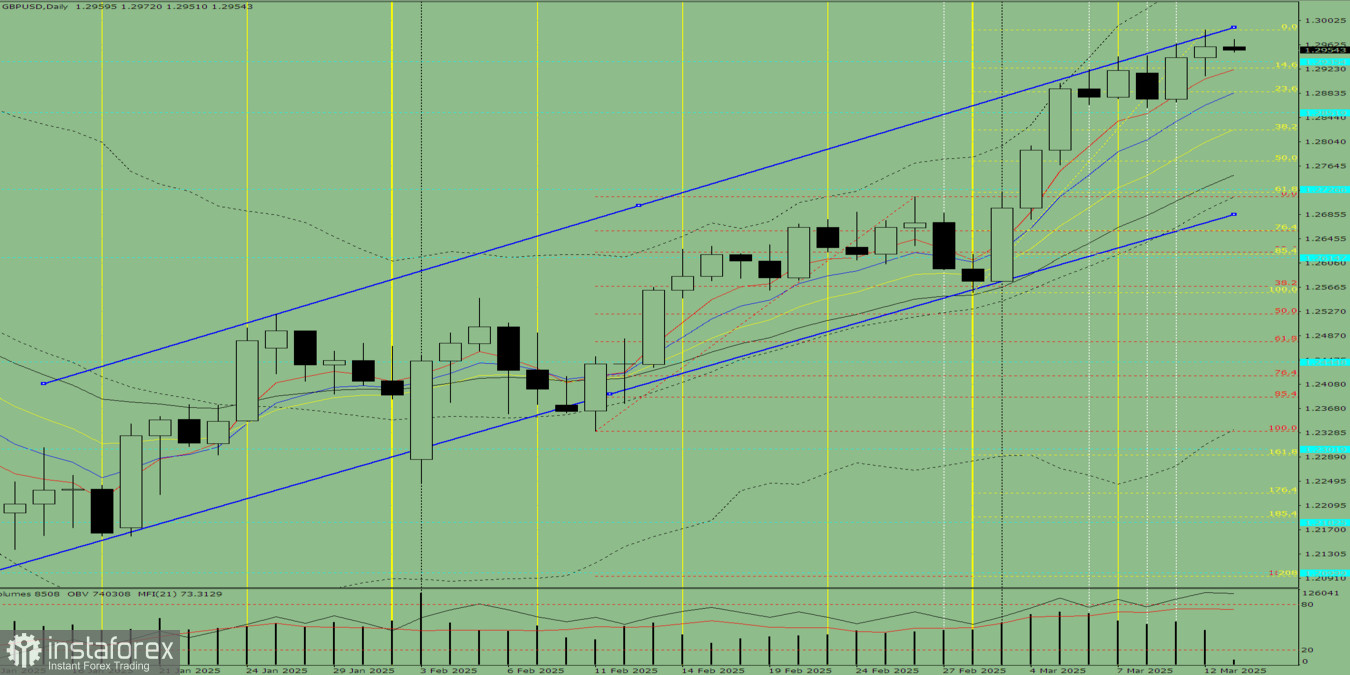
Fig. 1 (Daily Chart)
Comprehensive Analysis:
- Indicator Analysis: Bearish
- Fibonacci Levels: Bearish
- Volume Analysis: Bearish
- Candlestick Analysis: Bearish
- Trend Analysis: Bullish
- Bollinger Bands: Bullish
- Weekly Chart: Bearish
Overall Conclusion: Bearish trend.
Alternative Scenario:
The price could start moving downward from 1.2959 (yesterday's daily close) toward 1.2886 – the 23.6% retracement level (yellow dashed line). From this level, a potential upward correction to 1.2988 – the upper fractal (blue dashed line) may occur.