 English
  Русский
 Bahasa Indonesia
 Bahasa Malay
 ไทย
ไทย Español
 Deutsch
 Български
 Français
 Tiếng Việt
 中文
中文 বাংলা
বাংলা हिन्दी
 Čeština
 Українська
 Română

Over the past day and this morning, the euro has reached the target range of 1.1385–1.1420, corresponding to the highs of June 2019 and 2020. The signal line of the Marlin oscillator has slowed its climb in the overbought zone, reaching the peak last seen on March 11.
There are no other indications of trend exhaustion or reversal, so price action will likely continue to follow the upcoming target levels.
- If the price falls back below 1.1276, expect a move toward the 1.1110/50 range.
- A drop below that range opens the path toward 1.0955.
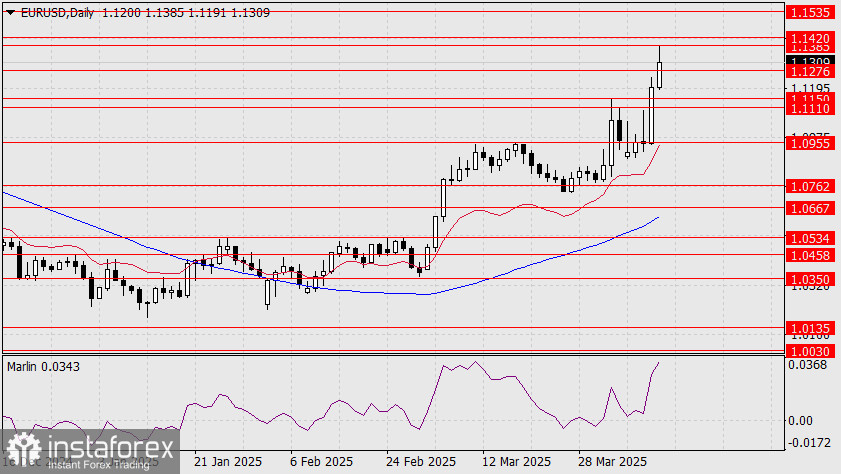
Should the price find the strength to break above the 1.1385–1.1420 range, the next target becomes 1.1535.
The H4 chart's technical picture is similar: the Marlin oscillator has reached a local high (this time from April 3), and the price is currently hovering around the 1.1276 support.
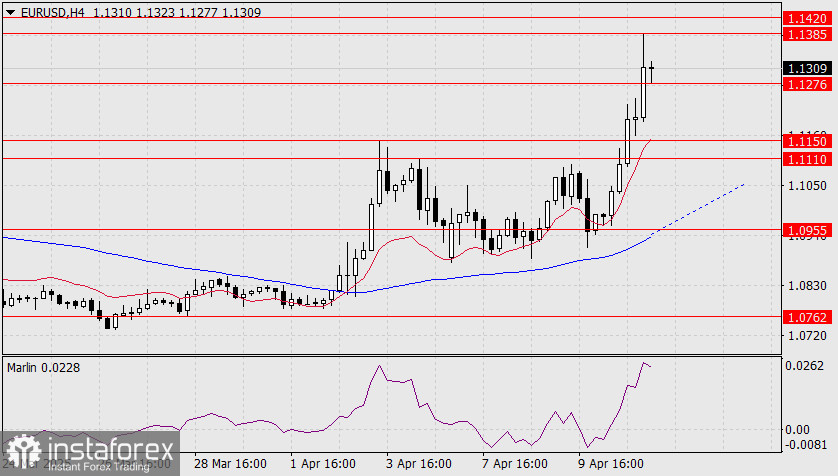
A confirmed break below 1.1276 opens the way to the target zone 1.1110/50.
The MACD line is approaching this support zone—if the price slows its descent and reaches the support area, this line could reinforce the range. A breakout below both the range and the indicator line would signal a medium-term trend reversal to the downside.