 English
  Русский
 Bahasa Indonesia
 Bahasa Malay
 ไทย
ไทย Español
 Deutsch
 Български
 Français
 Tiếng Việt
 中文
中文 বাংলা
বাংলা हिन्दी
 Čeština
 Українська
 Română

Yesterday, the UK released inflation data for March. Core CPI declined from 3.0% y/y to 2.8% y/y, and headline CPI dropped from 2.8% y/y to 2.6% y/y, below the forecast of 2.7% y/y. The attempt by the pound to rise toward the target level of 1.3311 was halted — the day ended with a gain of only 11 points, and this morning, the price is already moving into the 1.3184–1.3208 range.
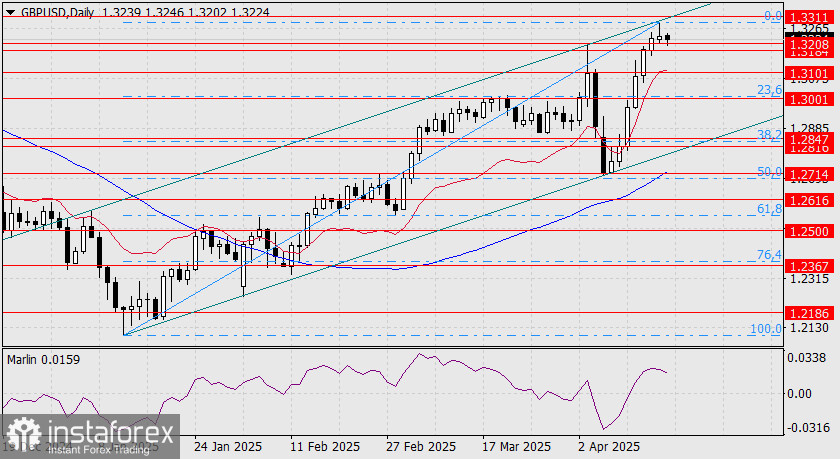
However, the daily chart shows that the price has precisely tested the upper boundary of the upward price channel. This test occurred a day earlier than our projection, but the bulls have done their job, and everything is now set for a reversal.
The growth from January 13 to April 16 is perfectly described by the Fibonacci grid. The 23.6% retracement level coincides with our support at 1.3101, and the 38.2% level aligns with the target range of 1.2816/47. The Kruzenshtern line is also heading toward that zone. A break below this support could pave the way for a long-term decline in the pound.
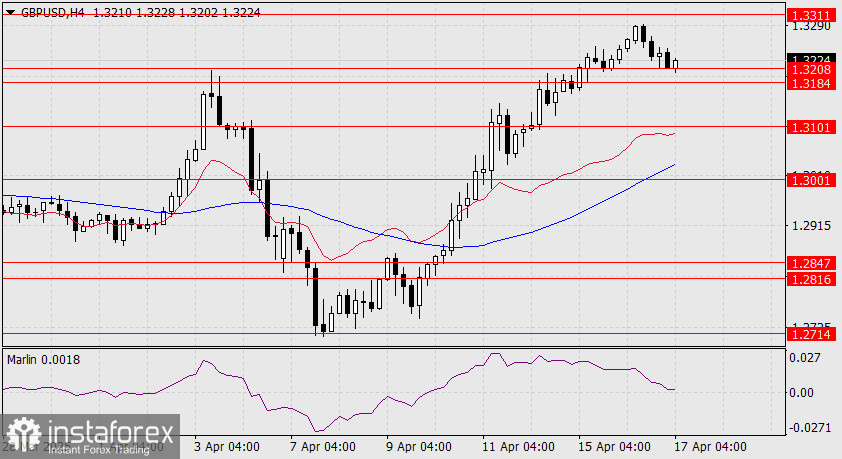
On the four-hour chart, the price is attempting to enter the 1.3184–1.3208 support range as the Marlin oscillator reaches the boundary of the downward trend territory. A simultaneous breakout below support by both the price and the oscillator will strengthen the bearish momentum. The first target is 1.3101.