 English
  Русский
 Bahasa Indonesia
 Bahasa Malay
 ไทย
ไทย Español
 Deutsch
 Български
 Français
 Tiếng Việt
 中文
中文 বাংলা
বাংলা हिन्दी
 Čeština
 Українська
 Română

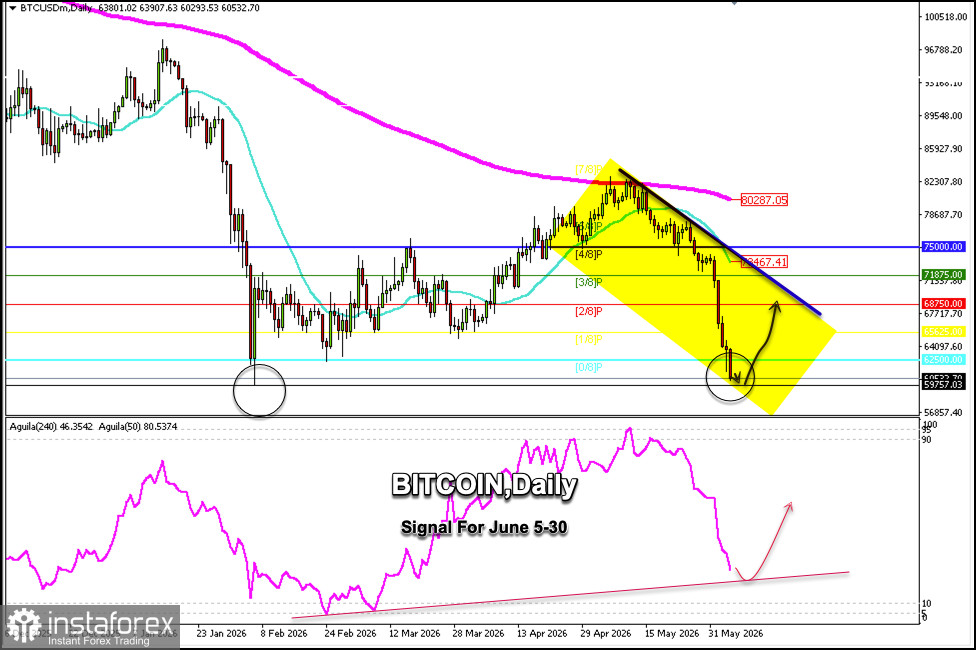
Bitcoin is trading around $60,532, reaching price levels last seen in February 2006 when it hit $59,735. Bitcoin could reach this low in the coming hours. If a technical bounce occurs, it could form a double bottom pattern, which would signify a sustained recovery in the short term.
The daily Bitcoin chart shows that it has reached oversold levels, and a recovery is technically expected in the coming hours.
Bearish pressure will continue over the next few days, so if a technical bounce occurs towards the strong Murray 2/8 support zone located around $68,750, the instrument could resume a bearish cycle.
Given that Bitcoin has reached the psychological level of $60,000, this level is key and decisive. Therefore, we would look for buying opportunities in the coming hours, always with a stop-loss order below the February low, with targets at the 0/8 Murray level around $62,500 and finally around $68,750.
If our strategy is bearish, we should wait for a technical bounce in the coming hours and then take short positions. A clear area to sell could be the $65,000 zone. This level also served as support in March and has now become strong resistance, so if Bitcoin reaches these levels, we could open short positions.
The daily chart shows that the Eagle indicator is showing a negative signal, so as long as the BTC/USD price remains below the 21 SMA and below the 200 SMA, any technical bounce in the medium term will be considered a signal to continue selling.