 English
  Русский
 Bahasa Indonesia
 Bahasa Malay
 ไทย
ไทย Español
 Deutsch
 Български
 Français
 Tiếng Việt
 中文
中文 বাংলা
বাংলা हिन्दी
 Čeština
 Українська
 Română

Trade Breakdown and Trading Tips for the Japanese Yen
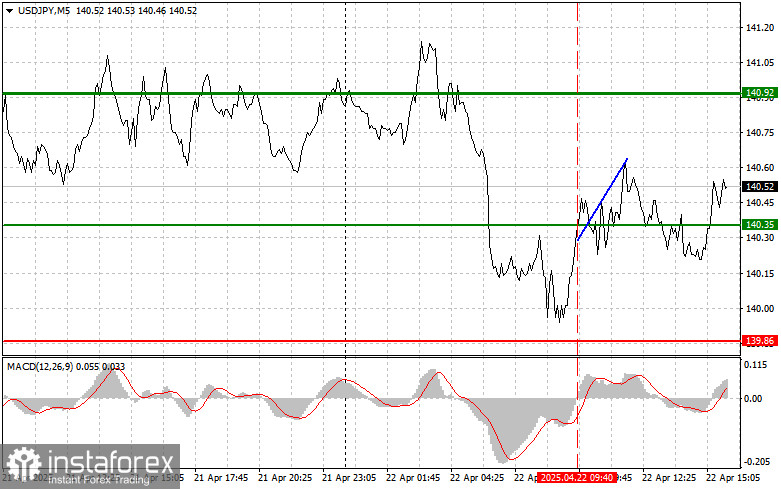
The first test of the 140.35 level occurred just as the MACD indicator began to move upward from the zero line, confirming a valid entry point for buying the dollar. As a result, the pair rose by 30 points.
During the U.S. session, FOMC members Philip N. Jefferson and Patrick T. Harker are scheduled to speak, along with the release of the Richmond Fed Manufacturing Index. It's important to monitor their rhetoric and the market's reaction to the published data. As an alternative scenario, the pair may consolidate in a narrow range. If there are no clear signals from the Fed and macro data remains neutral, this could lead to sideways movement in USD/JPY. For intraday traders, it's worth focusing on the support and resistance levels defined below.
For intraday strategy, I will rely primarily on executing Scenarios #1 and #2.
Buy Signal
Scenario #1: I plan to buy USD/JPY today on a dip to the entry level around 140.68 (green line on the chart) with a target of rising to 141.25 (thicker green line). Around 141.25, I'll exit long positions and open shorts in the opposite direction (targeting a 30–35 point reversal). Important: Before entering long, make sure the MACD is above the zero line and just beginning to rise.
Scenario #2: I will also buy USD/JPY if the price tests 140.31 twice, while the MACD is in oversold territory. This will limit the pair's downward potential and prompt a reversal to the upside. A move toward 140.68 and 141.25 may then follow.
Sell Signal
Scenario #1: I plan to sell USD/JPY today after a breakout below 140.31 (red line on the chart), which would likely lead to a sharp drop. The primary target for sellers will be 139.56, where I will exit short trades and consider immediate long entries (targeting a 20–25 point reversal). Important: Before entering short, ensure the MACD is below the zero line and just starting to decline.
Scenario #2: I'll also consider selling USD/JPY if the price tests 140.68 twice while the MACD is in overbought territory. This will limit the upward potential and prompt a reversal down toward 140.31 and 139.56.
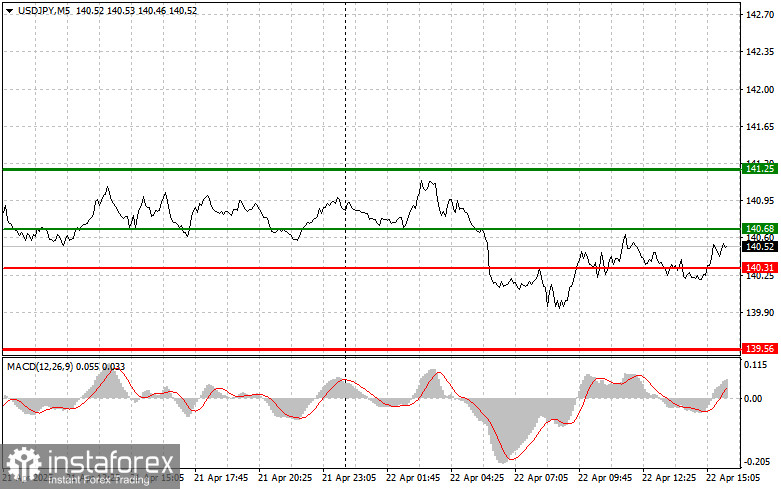
Chart Explanation
- Thin green line – entry price for long positions
- Thick green line – suggested Take Profit level or area to manually fix profits, as further growth is unlikely above this level
- Thin red line – entry price for short positions
- Thick red line – suggested Take Profit level or area to manually fix profits, as further decline is unlikely below this level
- MACD indicator – use this to confirm overbought or oversold market zones before entering trades
Important Note: Beginner Forex traders should be especially cautious when entering the market. It's best to remain on the sidelines before major fundamental reports to avoid sudden price swings. If you choose to trade during news releases, always place stop-loss orders to minimize losses. Without stop-losses, you can lose your entire deposit very quickly—especially if you don't use money management and trade large positions.
And remember, successful trading requires a clear trading plan—like the one presented above. Making spontaneous decisions based on current market movement is an inherently losing strategy for intraday traders.