 English
  Русский
 Bahasa Indonesia
 Bahasa Malay
 ไทย
ไทย Español
 Deutsch
 Български
 Français
 Tiếng Việt
 中文
中文 বাংলা
বাংলা हिन्दी
 Čeština
 Українська
 Română

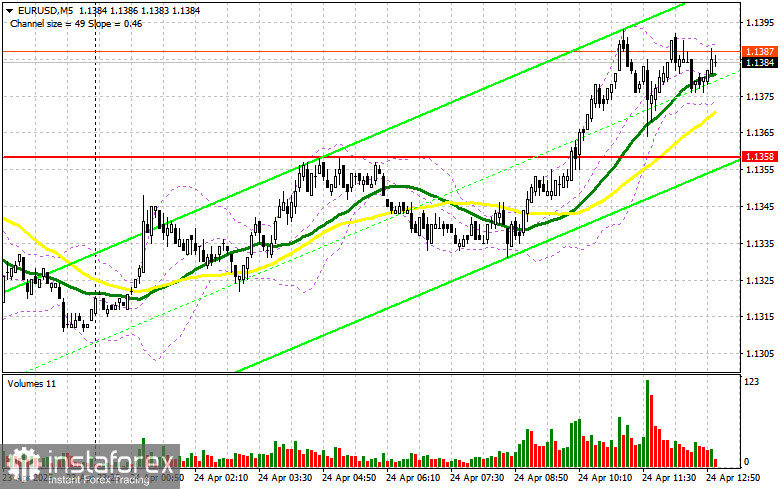
In my morning forecast, I focused on the 1.1358 level and planned to make trading decisions based on it. Let's take a look at the 5-minute chart to understand what happened. The pair did rise, but it didn't reach the retest of 1.1358, so I didn't enter any trades. The technical picture has been revised for the second half of the day.
To open long positions on EUR/USD:
The IFO data from Germany exceeded economists' forecasts, prompting a rise in the euro. However, buyers have so far only managed to halt the bearish trend, not reverse it in their favor.
In the second half of the day, we await figures on initial jobless claims, durable goods orders, and existing home sales in the U.S. Only strong data will bring pressure back on EUR/USD, and I plan to use that.
In case of a decline, only a false breakout around the new support at 1.1335 would serve as a signal to buy EUR/USD with the prospect of resuming the bullish trend and a retest of 1.1415. A breakout and retest of this range will confirm a valid long entry, with a move toward the 1.1487 area. The ultimate target will be 1.1571, where I plan to take profit.
If EUR/USD declines and there's no activity around 1.1335, pressure on the euro will intensify, potentially triggering a deeper correction to 1.1267. I will only consider buying euro after a false breakout at that level. I also plan to open long positions on a rebound from 1.1206, targeting an intraday upward correction of 30–35 points.
To open short positions on EUR/USD:
If the euro climbs again after the U.S. data, bears will need to show strength near 1.1415, where the moving averages also favor sellers. Only a false breakout at this level will be a signal to enter short positions with the goal of returning to 1.1335 — the support formed earlier today. A breakout and consolidation below this range would justify a move toward 1.1267, marking a fairly strong correction. The ultimate target for sellers will be 1.1206, where I plan to take profit. A test of this level would break the current bullish structure.
If EUR/USD rises during the second half of the day and sellers fail to show activity near 1.1415, buyers may push the pair to a new high of 1.1487. I will only sell there if the price fails to hold. I also plan to open short positions on a rebound from 1.1571, targeting a downward correction of 30–35 points.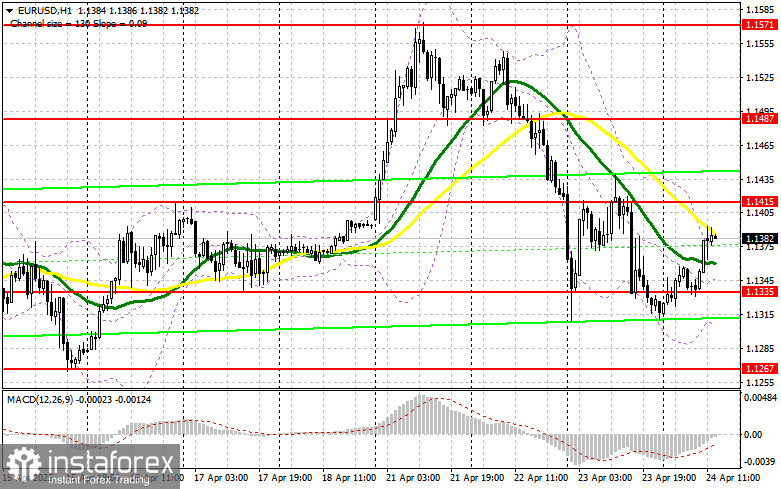
COT Report (Commitment of Traders):
The April 15 COT report showed an increase in long positions and a decrease in short ones. As the EU and U.S. have yet to reach a trade deal, the euro continues to strengthen while the dollar weakens. Potential instability from Trump's attempt to remove Jerome Powell as Fed Chair also continues to pressure the dollar. Long non-commercial positions rose by 6,807 to 197,103 and short non-commercial positions fell by 2,493 to 127,823. The gap between long and short positions narrowed by 2,493.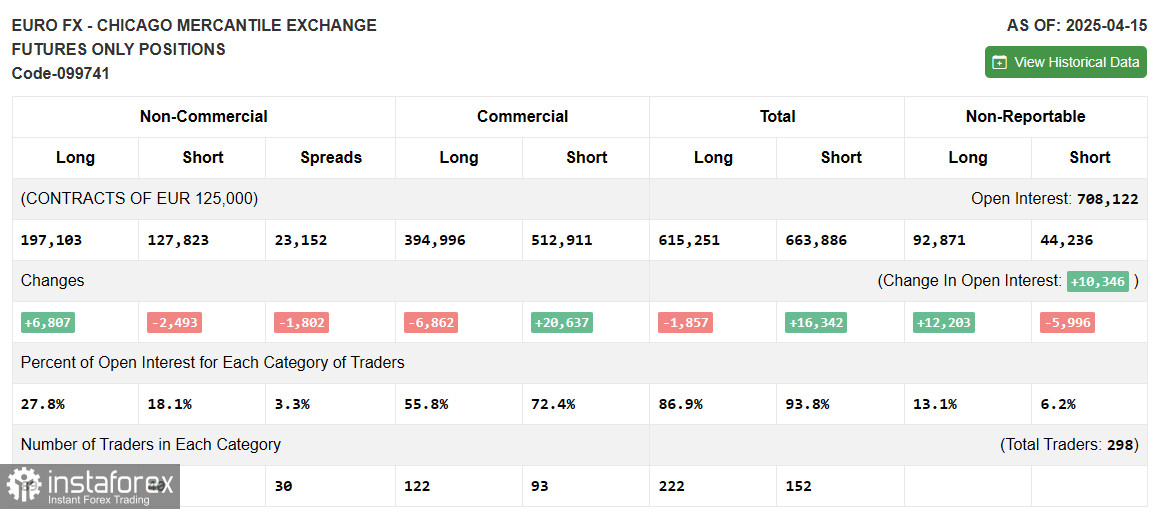
Indicator Signals:
Moving Averages: Trading is taking place around the 30- and 50-day moving averages, indicating market uncertainty.
Note: The author uses H1 hourly chart moving averages, which may differ from classical daily moving average values on a D1 chart.
Bollinger Bands: If the pair declines, the lower band near 1.1335 will act as support.
Indicator Descriptions:
- Moving Average (MA): Smooths out price fluctuations to identify trend direction. Periods: 50 (yellow), 30 (green)
- MACD: Moving Average Convergence Divergence. Fast EMA: 12, Slow EMA: 26, Signal SMA: 9
- Bollinger Bands: Measures volatility and possible price reversal points. Period: 20
- Non-commercial traders: Speculators like individual traders, hedge funds, and large institutions trading futures for profit
- Long non-commercial positions: Total long positions held by speculators
- Short non-commercial positions: Total short positions held by speculators
- Net non-commercial position: Difference between long and short positions held by speculators.