 English
  Русский
 Bahasa Indonesia
 Bahasa Malay
 ไทย
ไทย Español
 Deutsch
 Български
 Français
 Tiếng Việt
 中文
中文 বাংলা
বাংলা हिन्दी
 Čeština
 Українська
 Română

In my morning forecast, I highlighted the 1.3293 level and planned to use it as a reference for entering the market. Let's look at the 5-minute chart and analyze what happened. A breakout and retest of 1.3239 provided an entry point for long positions, which led to a rise of more than 20 points, although the pair didn't quite reach the target levels. The technical outlook was revised for the second half of the day.
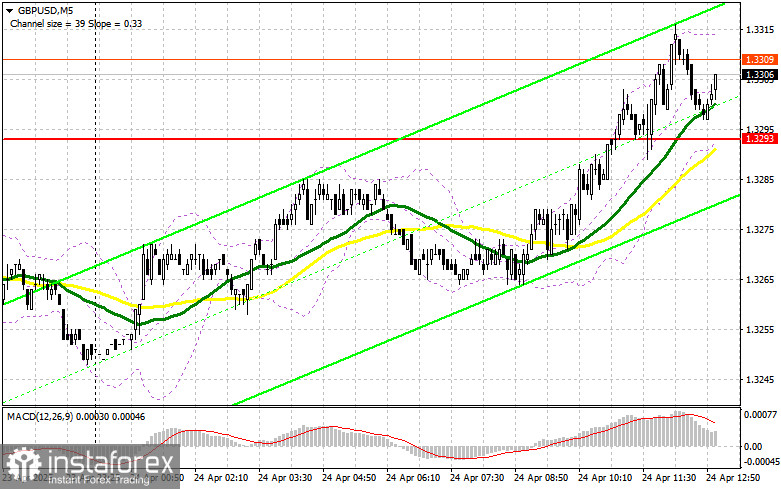
To open long positions on GBP/USD:
Positive data on industrial order balances from the Confederation of British Industry supported the pound in the first half of the day, allowing it to rebound from weekly lows in hopes of resuming the bullish trend.
In the second half of the day, traders will focus on U.S. data: initial jobless claims, durable goods orders, and existing home sales. Only very strong numbers will bring back pressure on the pound. Otherwise, the bullish trend may continue.
In case of a pullback, I will act after a false breakout around the new support at 1.3292 (formed earlier today). This would give a good entry point for long positions with the aim of recovering to the 1.3333 resistance. A breakout and retest of this range from above would provide another entry point to target an update of 1.3375, which would strengthen the bullish market. The ultimate target will be the 1.3416 area, where I plan to take profit.
If GBP/USD falls and there is no bullish activity around 1.3292 in the second half of the day, pressure on the pair will return. In that case, only a false breakout around 1.3251 will provide a reason to buy. I also plan to buy GBP/USD on a rebound from 1.3205, targeting an intraday correction of 30–35 points.
To open short positions on GBP/USD:
Sellers did not show up during the first half of the day, so there may be difficulties pushing the pair down during the U.S. session as well.
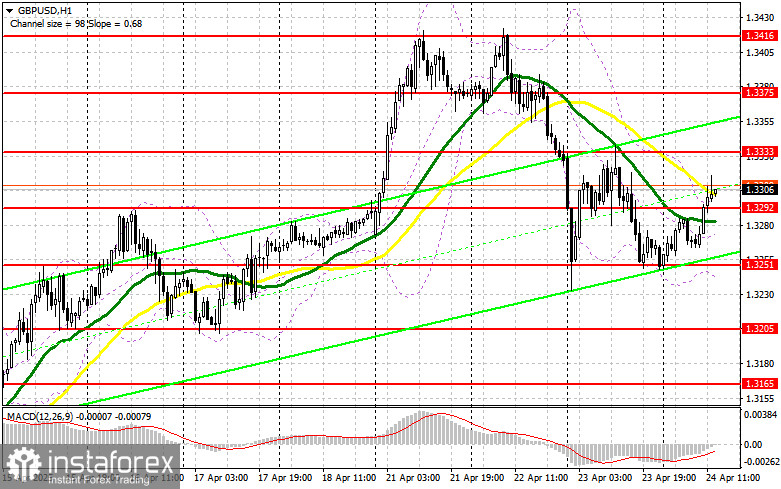
If the pound rises again, I plan to act near the 1.3333 resistance. A false breakout at this level will provide an entry point for short positions aiming for a decline toward 1.3292, where the moving averages are currently located. A breakout and retest of this range from below would trigger stop orders and pave the way to 1.3251. The ultimate target for sellers will be the 1.3205 area, where I plan to take profit.
If demand for the pound persists in the second half of the day and bears do not show activity around 1.3333, it's better to wait for a test of 1.3375 resistance. I will only open short positions there after a failed breakout. If there is no downward move even there, I will look for short entries on a rebound from 1.3416, targeting a 30–35 point correction.
COT Report (Commitment of Traders) – April 15:
The report showed a rise in short positions and a decrease in long ones. Interestingly, despite this, the pound continued to show confident growth against the dollar. However, this data lags behind market reality. The recent GBP/USD rally is directly linked to Trump's stance on tariffs and dissatisfaction with Fed Chair Jerome Powell, which puts more pressure on the dollar than it gives support to the pound. Long non-commercial positions decreased by 6,025 to 85,708 and short non-commercial positions rose by 4,776 to 79,199. The net position spread narrowed by 439.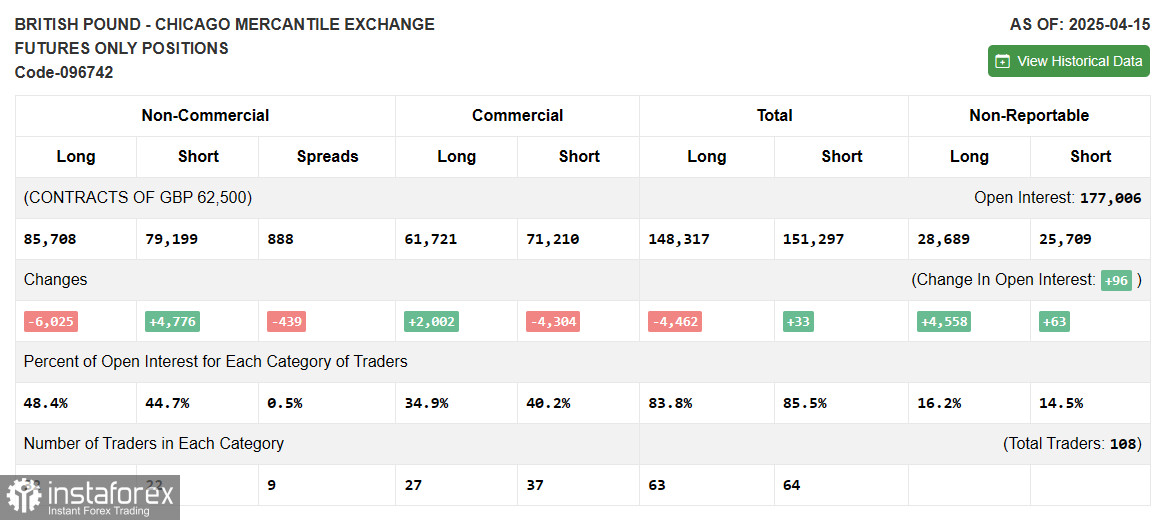
Indicator Signals:
Moving Averages: The pair is trading near the 30- and 50-day moving averages, indicating market indecision.
Note: The author analyzes these on the H1 chart, which may differ from the classic D1 moving averages.
Bollinger Bands: In case of a decline, the lower band around 1.3270 will serve as support.
Indicator Descriptions:
- Moving Average (MA): Smooths volatility to determine the trend. Periods: 50 (yellow), 30 (green)
- MACD (Moving Average Convergence/Divergence): Fast EMA = 12, Slow EMA = 26, Signal SMA = 9
- Bollinger Bands: Measures volatility and price reversal points. Period = 20
- Non-commercial traders: Speculators such as individual traders, hedge funds, and institutions trading futures for profit
- Long non-commercial positions: Total open long positions held by speculators
- Short non-commercial positions: Total open short positions held by speculators
- Net non-commercial position: Difference between short and long non-commercial positions