 English

 Русский
 Bahasa Indonesia
 Bahasa Malay
 ไทย
 Español
 Deutsch
 Български
 Français
 Tiếng Việt
 中文
 বাংলা
 हिन्दी
 Čeština
 Українська
 Română



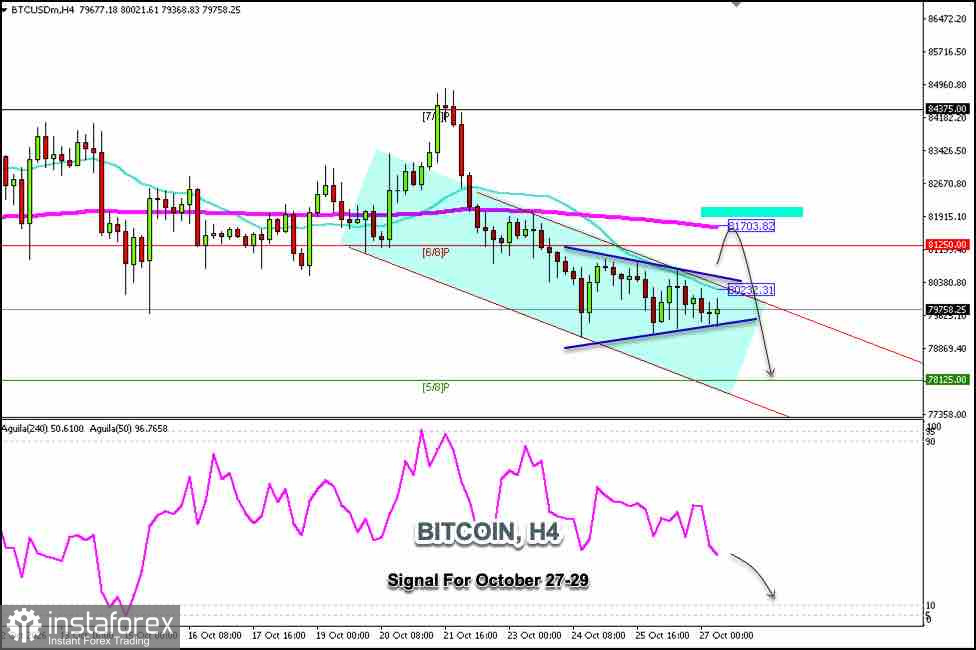
Bitcoin is trading around $79,758 within a symmetrical triangle pattern and a downtrend channel that has been forming since October 20. Technically, Bitcoin is under downward pressure, but at the same time, we also observe that it appears to be consolidating.
If Bitcoin consolidates above $80,500 in the coming hours, the outlook could change, and we could expect the price to reach the 200-period exponential moving average (EMA) around $81,703; ultimately, if the cryptocurrency breaks above this zone, it could reach the 7/8 Murray level, around $84,375.
Conversely, if Bitcoin breaks below the symmetrical triangle pattern and consolidates below this zone, it could be expected to continue falling until it reaches the 5/8 Murray level; this level, in turn, could provide strong support and trigger a technical rebound for Bitcoin.
We must closely monitor BTC's price movements over the next few hours: above $80,500, there is a strong bullish signal, while below $79,000, there is strong bearish pressure that could cause Bitcoin to continue falling.
Below $78,125, a fast track opens up toward $75,000, and Bitcoin could easily reach these levels.
The Eagle indicator is showing a bearish signal, so we believe Bitcoin will experience a technical rebound toward the 6/8 Murray level or the 200-day EMA, where it could encounter strong resistance and thus resume its downtrend.