 English
  Русский
 Bahasa Indonesia
 Bahasa Malay
 ไทย
ไทย Español
 Deutsch
 Български
 Français
 Tiếng Việt
 中文
中文 বাংলা
বাংলা हिन्दी
 Čeština
 Українська
 Română

EUR/USD 5-Minute Analysis
The EUR/USD currency pair showed no notable movements on Wednesday, and the market displayed no interest in Donald Trump's trade deals. As we've said repeatedly, what's the point of trade agreements if all tariffs remain in place? When trade talks began, the market anticipated that they would eventually end the trade war—or at least result in fair agreements without piles of tariffs and conditions. But in practice, we're seeing the opposite. Deals are either signed the way Trump wants them or not signed at all. Four deals in four months speak for themselves.
Thus, although the U.S. dollar managed to gain slightly on Wednesday, it is now entering a new downward (for itself) trend. For three weeks, the EUR/USD pair corrected on purely technical grounds, but every fairy tale comes to an end. Trump's trade policies and governance methods continue to displease the majority of currency market participants. As a result, we still see no prospects for the American currency. Perhaps it will continue to weaken at a slower pace, but it will weaken.
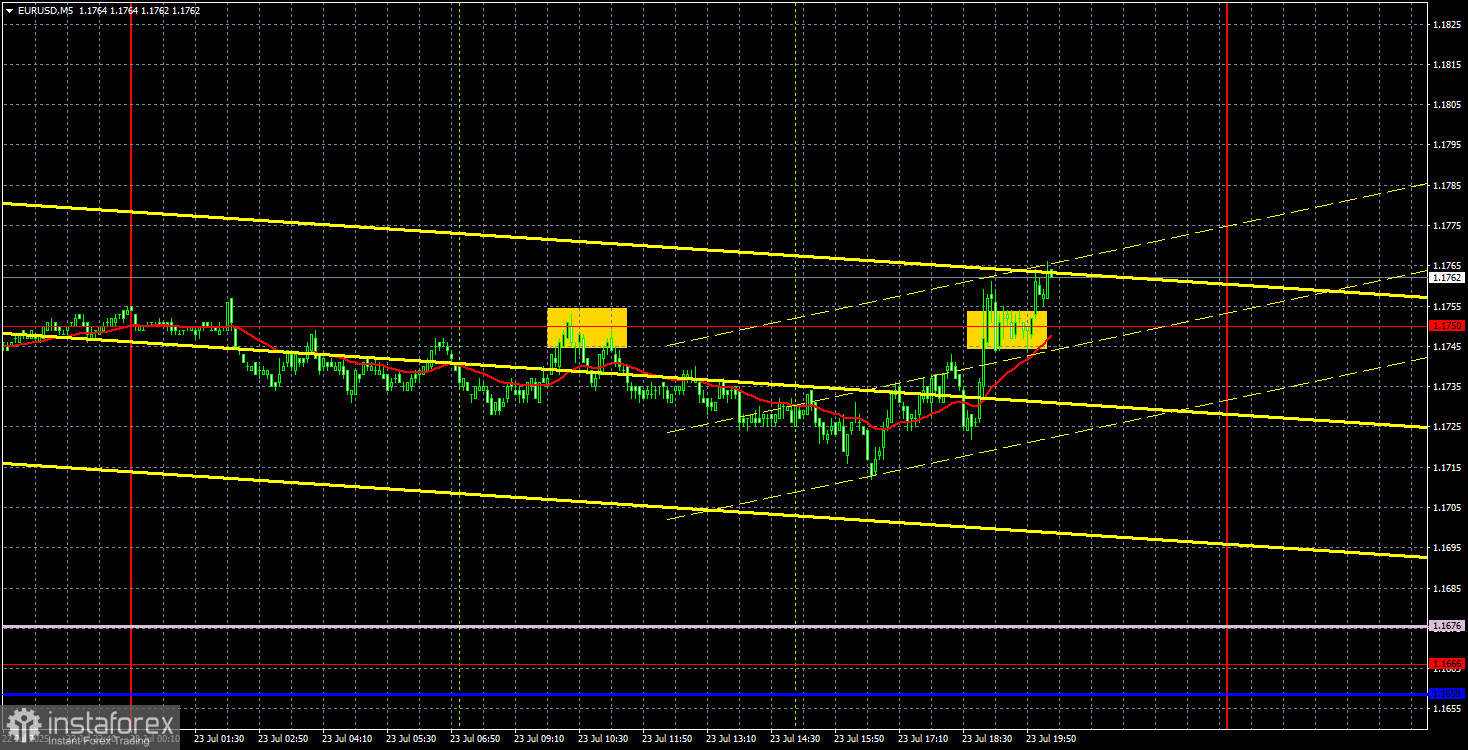
In the 5-minute time frame on Wednesday, only one trading signal was formed during the day. During the European session, the price bounced off the 1.1750 level, but the day's total volatility was only 45 pips. With such low volatility, it was extremely difficult to make a profit from any signal. In the evening, the price consolidated above the 1.1750 level, allowing us to expect further growth of the euro.
COT Report
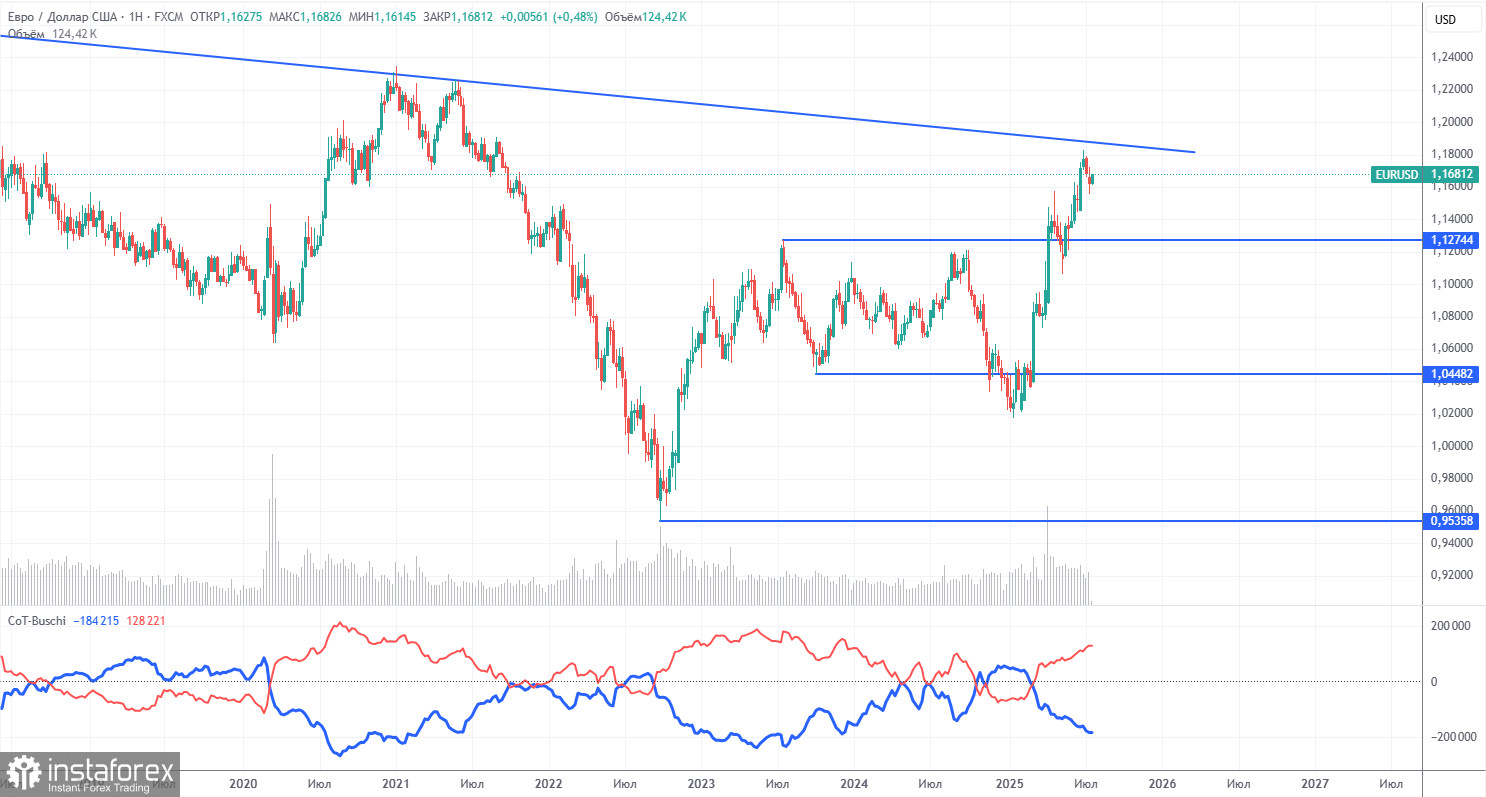
The latest COT report is dated July 15. As shown in the chart above, the net position of non-commercial traders had been bullish for a long time. Bears only barely gained the upper hand at the end of 2024—and then quickly lost it. Since Trump took office, the dollar has been the only currency to fall. While we can't say with 100% certainty that the U.S. currency will continue to decline, current global developments suggest that scenario.
We still do not see any fundamental reasons for the strengthening of the euro; however, one very strong factor remains for the dollar's continued decline. The global downtrend persists—but does it matter now where the price has moved over the past 16 years? Once Trump ends his trade wars, the dollar may resume growth—but will Trump ever end them? And when?
The position of the red and blue indicator lines still points to a bullish trend. During the latest reporting week, the number of long positions in the "Non-commercial" group increased by 1,000 contracts, while short positions decreased by 6,600. As a result, the net position increased by 7,600 contracts.
EUR/USD 1-Hour Analysis
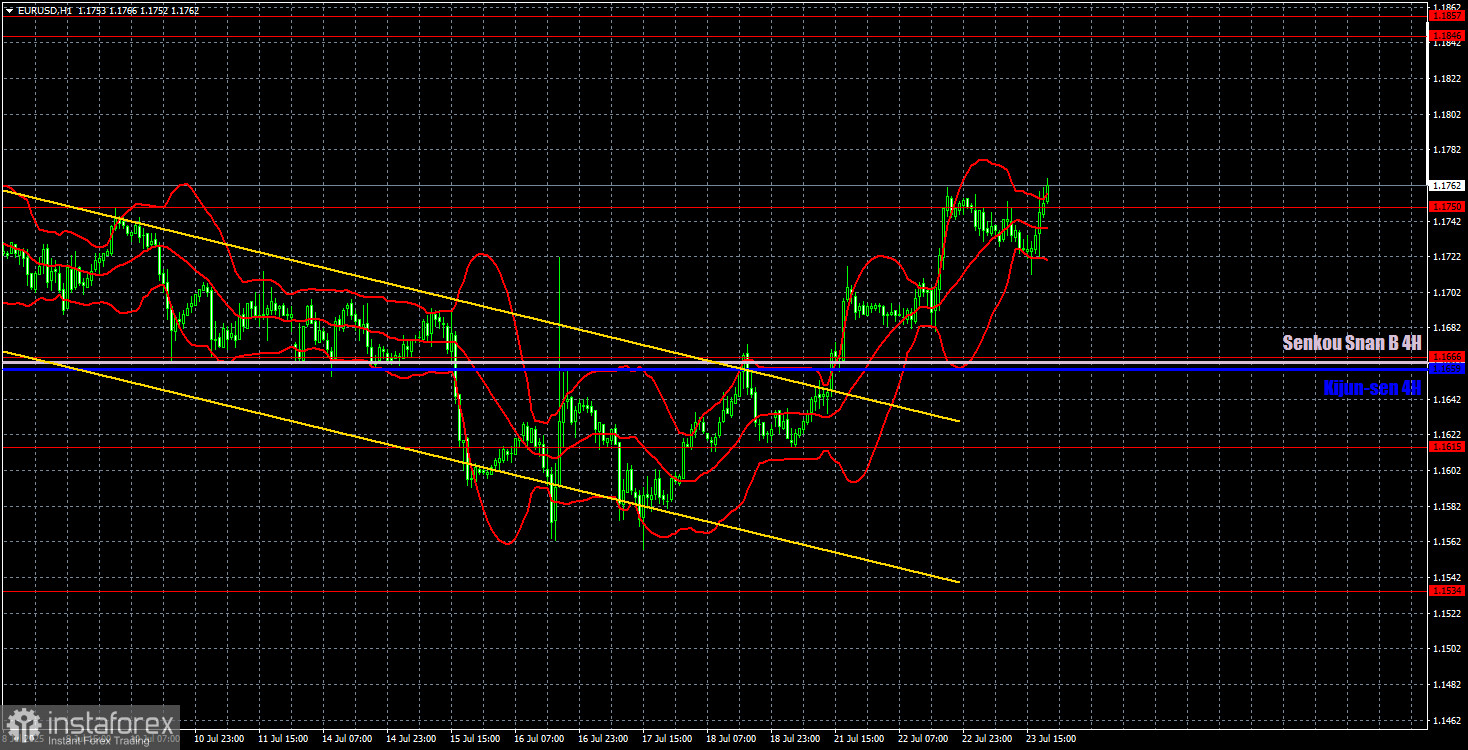
On the hourly time frame, the EUR/USD pair continues forming a new uptrend. Trump continues to raise and introduce new tariffs, while the likelihood of signing trade deals with anyone from Trump's "blacklist" becomes increasingly doubtful. Without trade deals, the trade war escalates further; with trade deals, it simply continues, as all of Trump's tariffs remain in place. Trump's war with Powell is another factor contributing to the dollar's decline in 2025.
For July 24, we highlight the following levels for trading: 1.1092, 1.1147, 1.1185, 1.1234, 1.1274, 1.1362, 1.1426, 1.1534, 1.1615, 1.1666, 1.1750, 1.1846–1.1857, as well as the Senkou Span B line (1.1662) and the Kijun-sen line (1.1659). The Ichimoku indicator lines may fluctuate throughout the day, which should be taken into account when identifying trading signals. Don't forget to set Stop Loss to breakeven if the price moves 15 pips in the correct direction. This will protect against potential losses if the signal turns out to be false.
On Thursday, business activity indices for July in the services and manufacturing sectors are scheduled to be published in the Eurozone, Germany, and the U.S. Although these are not the most important releases, they may provoke a minor market reaction that is unlikely to affect overall trader sentiment. In the Eurozone, the European Central Bank meeting is scheduled, but no major decisions are expected. Therefore, today's trading is likely to remain fairly uneventful. A breakout above the 1.1750 level enables traders to initiate new long positions and anticipate further growth.
Illustration Explanations:
- Support and resistance price levels – thick red lines where movement may end. They are not trading signal sources.
- Kijun-sen and Senkou Span B lines—These are strong Ichimoku indicator lines transferred to the hourly timeframe from the 4-hour one.
- Extremum levels – thin red lines where the price has previously rebounded. These act as trading signal sources.
- Yellow lines – trend lines, trend channels, and other technical patterns.
- COT Indicator 1 on the charts – the size of the net position for each category of traders.