 English
  Русский
 Bahasa Indonesia
 Bahasa Malay
 ไทย
ไทย Español
 Deutsch
 Български
 Français
 Tiếng Việt
 中文
中文 বাংলা
বাংলা हिन्दी
 Čeština
 Українська
 Română

The EUR/USD currency pair continued its upward movement on Wednesday, and this time even the signing of yet another trade agreement couldn't save the dollar... So, Donald Trump signed a new "grand, profitable, historic, and tremendous" trade deal with Japan. This time, the media even gained access to some details of the agreement. What is known so far?
All imports from Japan will be subject to a 15% tariff. And that's the most important part of the deal. In other words, for the fourth time, market participants were able to see that a true trade truce is fundamentally impossible. What would a trade truce look like? For example, Japan, in response to Trump's complaints about the U.S. trade deficit, could increase purchases of goods and raw materials from the U.S. to balance the figures. Such a step could be considered a "trade truce." But no—Japanese goods (in particular, cars) will simply be taxed at 15%. So where's the truce? Is it the fact that the tariffs are 15%, and not 25% or more?
Japan also committed to opening its market to American car manufacturers. In addition, Tokyo will create an investment fund of 550 billion dollars to be directed into the U.S. economy. And this is the most interesting and, arguably, the most controversial part of the deal. No one understands how this will work in practice. Tokyo will send hundreds of billions of dollars into the U.S. economy, but will Trump manage the funds? According to official information, Trump will decide which sectors receive these Japanese investments. Moreover, according to media reports, 90% of the investment returns will go to the U.S. This raises a question: why would Japan invest such a massive amount of money if 90% of the returns go to the U.S.? In our view, the real terms of the deal differ significantly from those published and announced. Or perhaps the White House has deliberately released misleading information. Considering how many times per day Trump misleads the markets, this is easy to believe. For example, just the other day, Trump claimed he was surprised by Jerome Powell's appointment as Federal Reserve Chair.
How did the market react to this "historic deal"?
The U.S. dollar continues to decline, and no conclusions can be drawn from the U.S. stock indices. The U.S. stock market continues to inflate like a "bubble," and the growth of investment in the American sector no longer means that the economy is healthy or that U.S. companies have bright prospects. Many experts note that U.S. stocks are overvalued by at least 50–60%. Perhaps the "bubble" won't burst in the near future, but drawing conclusions based on rising U.S. indices is something we definitely would not recommend.
Regarding the U.S. dollar exchange rate, we can draw conclusions. And the dollar showed absolutely no growth in response to the deal with Japan. What does this tell us? The market places very little value on such deals, where the U.S. trade partner agrees to pay tariffs and fulfill a long list of White House demands. Take Japanese cars, for instance, which make up a significant portion of Japan's exports to the U.S. Their prices are expected to rise by 15%. Naturally, demand will fall, and inflation in the U.S. will continue to rise.
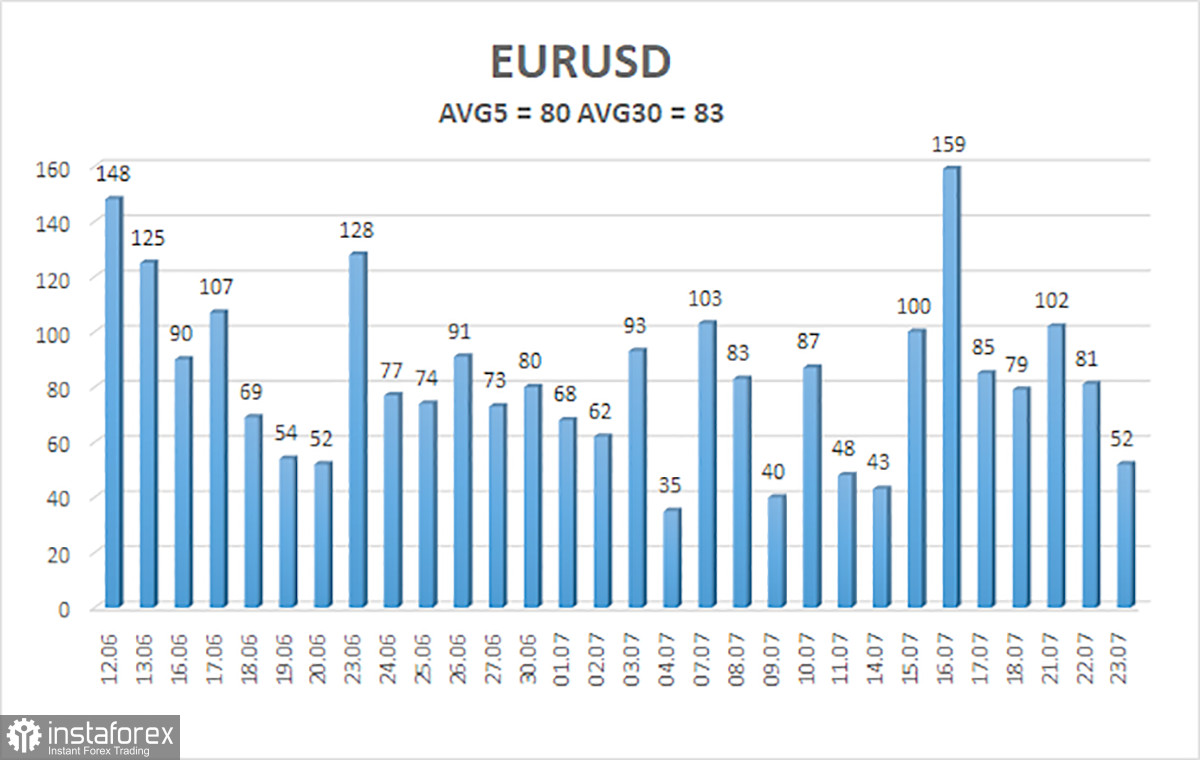
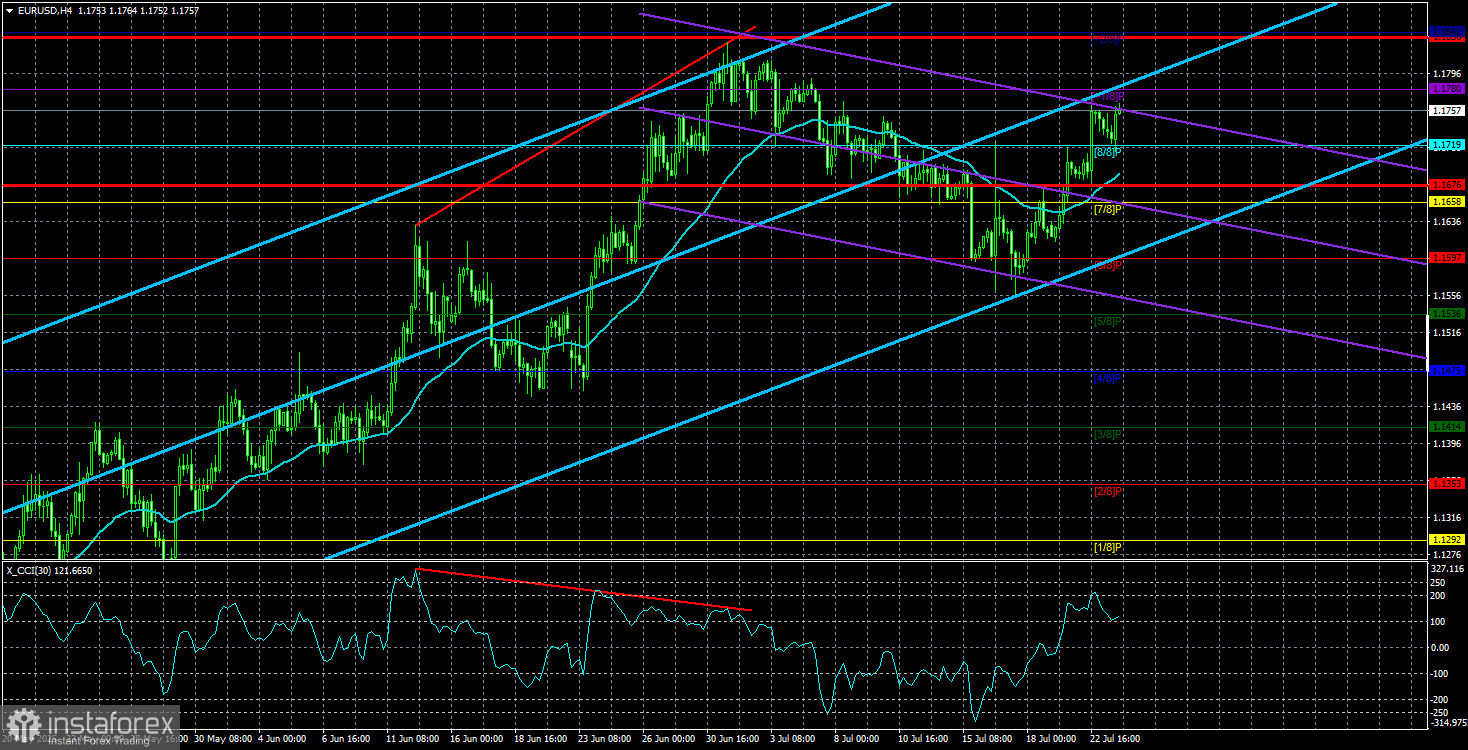
The average volatility of the EUR/USD pair over the last five trading days, as of July 24, is 80 pips, characterized as "moderate." We expect the pair to move between the levels of 1.1676 and 1.1836 on Thursday. The long-term linear regression channel is pointing upward, indicating a sustained upward trend. The CCI indicator dipped into oversold territory, signaling a resumption of the upward trend.
Nearest Support Levels:
S1 – 1.1719
S2 – 1.1658
S3 – 1.1597
Nearest Resistance Levels:
R1 – 1.1780
R2 – 1.1841
Trading Recommendations:
The EUR/USD pair has resumed its uptrend. At the very least, the price has consolidated above the moving average and continues heading north. Trump's policies—both foreign and domestic—continue to exert a strong negative influence on the U.S. dollar. In recent weeks, the dollar has gained slightly, but from our perspective, medium-term buying remains off the table.
If the price moves below the moving average, small short positions may be considered with targets at 1.1597 and 1.1536, based solely on technical factors. Above the moving average line, long positions remain relevant with targets at 1.1780 and 1.1830, in line with the ongoing trend.
Explanation of Illustrations:
Linear Regression Channels help determine the current trend. If both channels are aligned, it indicates a strong trend.
Moving Average Line (settings: 20,0, smoothed) defines the short-term trend and guides the trading direction.
Murray Levels act as target levels for movements and corrections.
Volatility Levels (red lines) represent the likely price range for the pair over the next 24 hours based on current volatility readings.
CCI Indicator: If it enters the oversold region (below -250) or overbought region (above +250), it signals an impending trend reversal in the opposite direction.