 English
  Русский
 Bahasa Indonesia
 Bahasa Malay
 ไทย
ไทย Español
 Deutsch
 Български
 Français
 Tiếng Việt
 中文
中文 বাংলা
বাংলা हिन्दी
 Čeština
 Українська
 Română

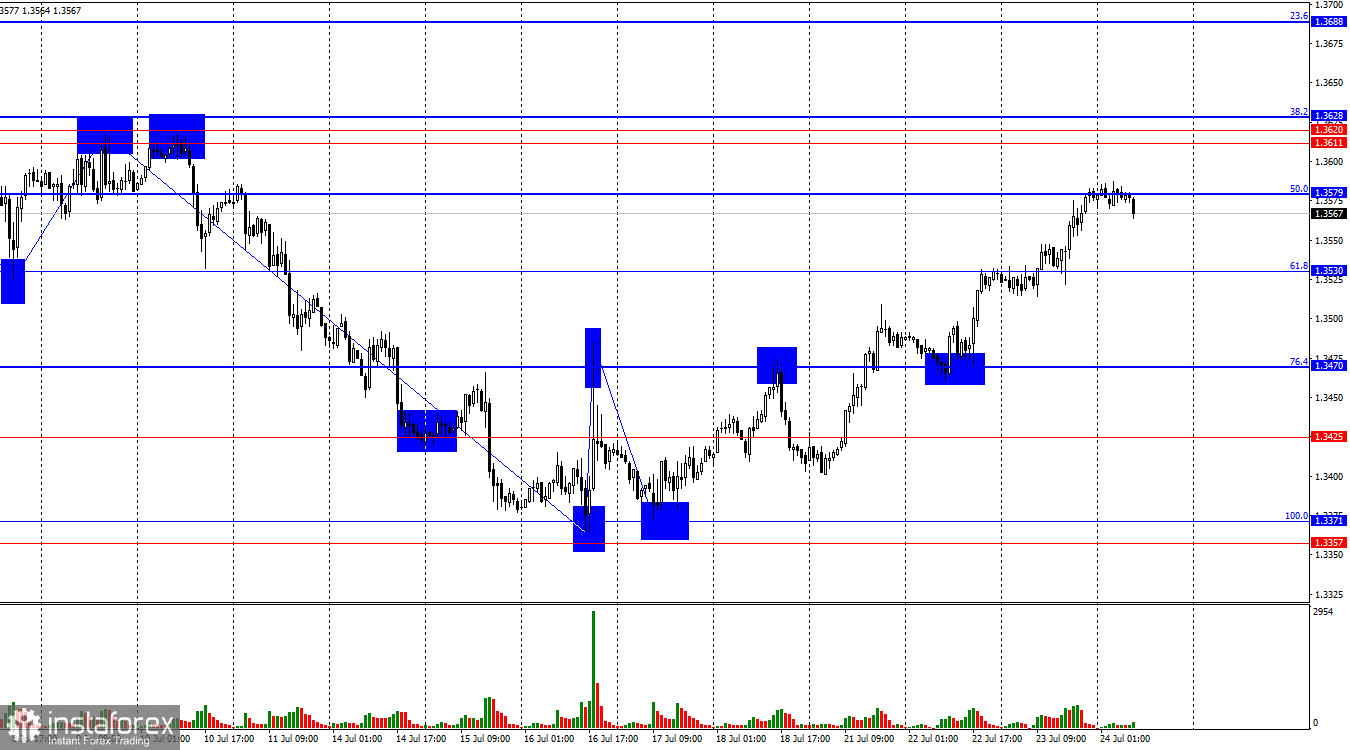
The wave structure has shifted in favor of the bulls, as expected. Several downward waves were formed, each breaking below the low of the previous one. At present, the latest upward wave has broken above the highs of the two previous waves, thus breaking not just a bearish trend, but even the corrective bearish pullback. Based on the wave structure, I expect the quotes to rise in the near term.
The news background this week is relatively limited, but traders are not lacking important information. Yesterday, Donald Trump announced the signing of what he described as a truly beneficial deal with Japan. Under the agreement, Japan commits to investing over half a billion dollars into the U.S. economy and to paying 15% tariffs on imports to the US. US imports to Japan will also be subject to 15% duties. This appears to be the first relatively balanced deal with reciprocal, rather than one-sided, tariffs. Bearish traders were not pleased with this agreement—and understandably so. Only one deal has been signed (out of 4 or 5), while over seventy remain unsigned. On August 1, tariffs could significantly increase for a range of countries. Thus, the negative backdrop for the dollar still outweighs the positive.
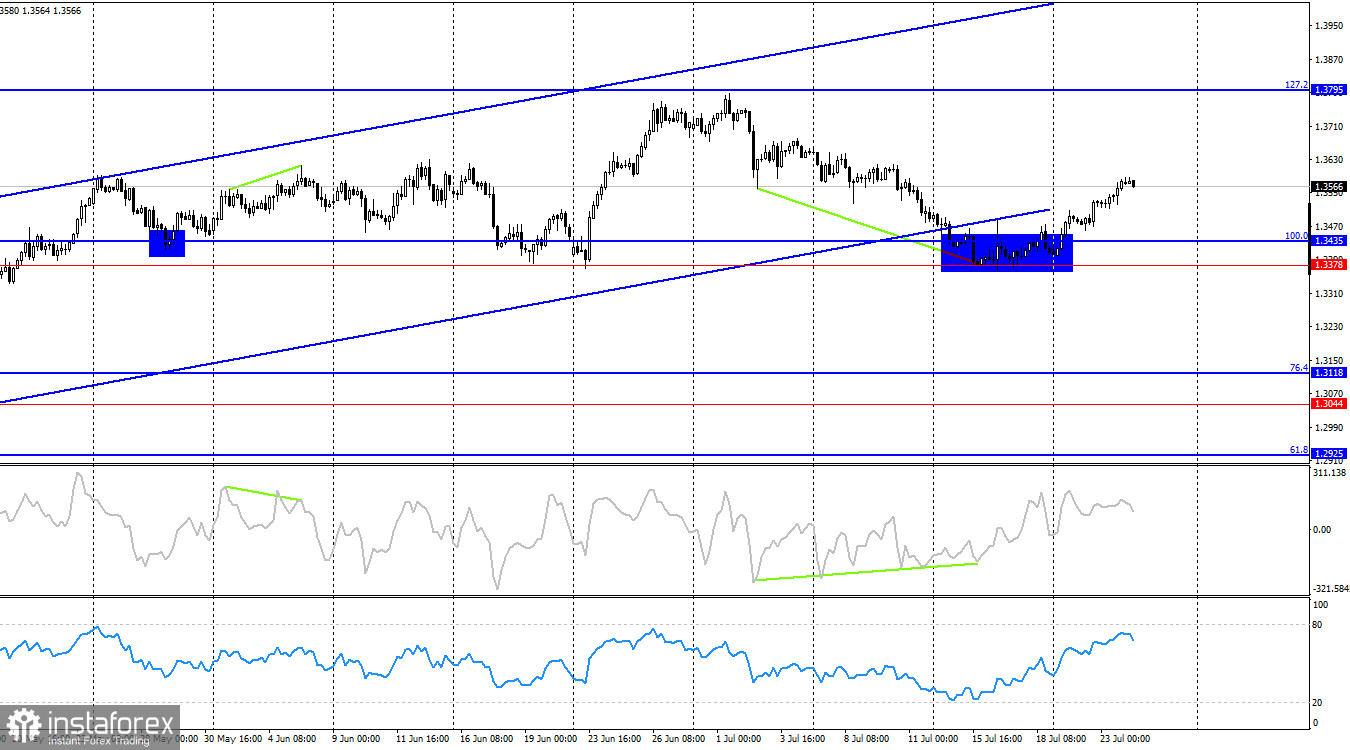
On the 4-hour chart, the pair overall continues its decline, but after forming a bullish divergence, it reversed in favor of the pound and bounced off the support zone of 1.3378–1.3435. This suggests the upward movement could continue toward the 127.2% Fibonacci retracement level at 1.3795. The hourly chart also supports the potential for the bullish trend to resume. No emerging divergences are currently observed on any indicators.
Commitments of Traders (COT) Report:
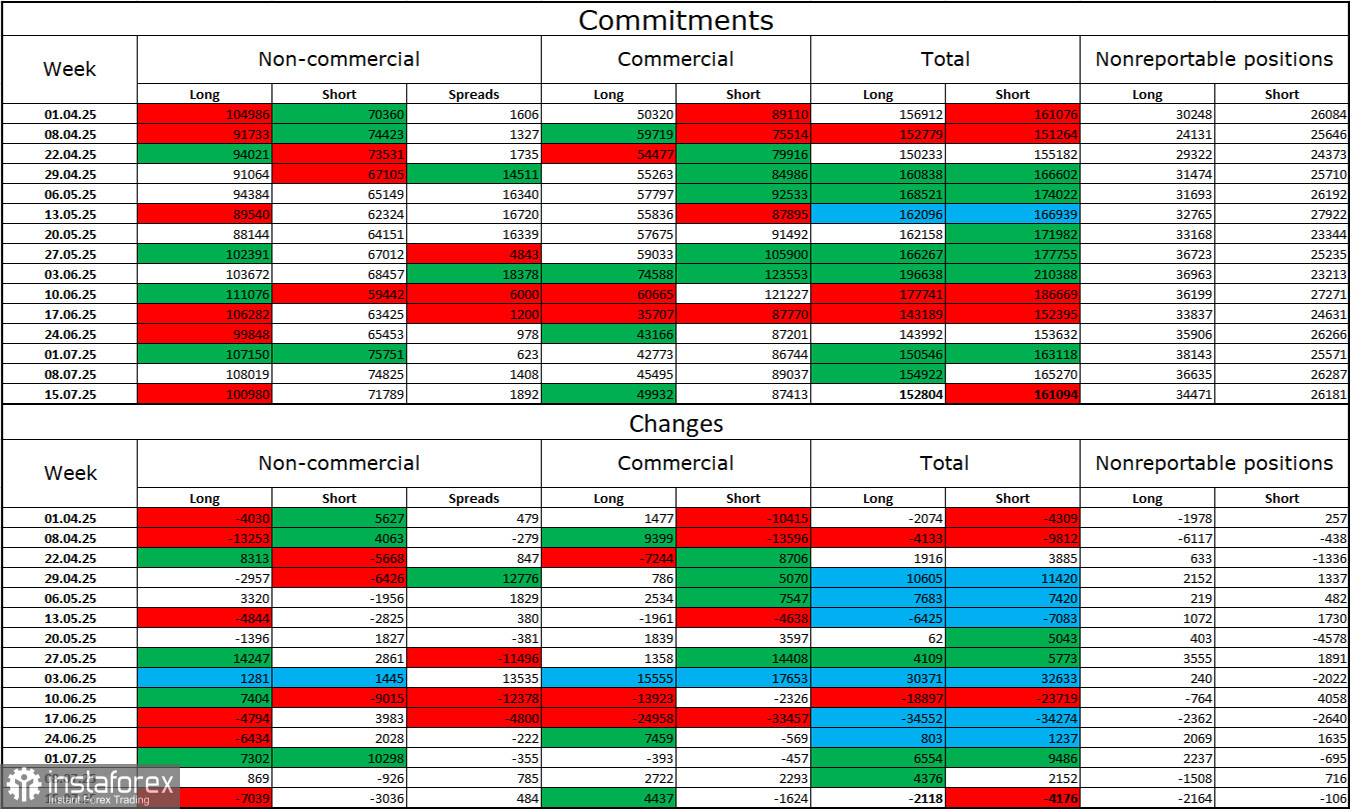
Sentiment among the "Non-commercial" trader category became slightly less bullish in the last reporting week. The number of long positions held by speculators decreased by 7,039, while short positions decreased by 3,036. However, bears have long lost their market advantage and have no real chance of success. The gap between long and short positions stands at 30,000 in favor of the bulls—101,000 versus 71,000.
In my view, the pound still has downward potential, but events in 2025 have completely reversed the market outlook in the long term. Over the past four months, the number of long positions has grown from 65,000 to 101,000, while short positions have declined from 76,000 to 71,000. These changes are not as significant as for the euro, but they are still notable. Under Donald Trump, confidence in the dollar has weakened, and COT reports show that traders are not inclined to buy it. Therefore, regardless of the general news flow, the dollar continues to fall amid developments surrounding Trump.
Economic Calendar – U.S. and UK (July 24):
- UK – Manufacturing PMI (08:30 UTC)
- UK – Services PMI (08:30 UTC)
- U.S. – Initial Jobless Claims (12:30 UTC)
- U.S. – Manufacturing PMI (13:45 UTC)
- U.S. – Services PMI (13:45 UTC)
On Thursday, the economic calendar includes several similar entries. The impact of the news background on trader sentiment may be limited today.
GBP/USD Forecast and Trading Advice:
I do not recommend considering selling the pair, as the dollar, in my view, has already exceeded expectations. Buy positions could have been opened at the rebound from the 1.3357–1.3371 zone or after a close above 1.3470, targeting 1.3530 and 1.3579—both targets have been met. Further buying can be considered after a close above 1.3579.
Fibonacci levels are plotted from 1.3371 to 1.3787 on the hourly chart, and from 1.3431 to 1.2104 on the 4-hour chart.