 English
  Русский
 Bahasa Indonesia
 Bahasa Malay
 ไทย
ไทย Español
 Deutsch
 Български
 Français
 Tiếng Việt
 中文
中文 বাংলা
বাংলা हिन्दी
 Čeština
 Українська
 Română

Analysis of Thursday's Trades
1H Chart of EUR/USD
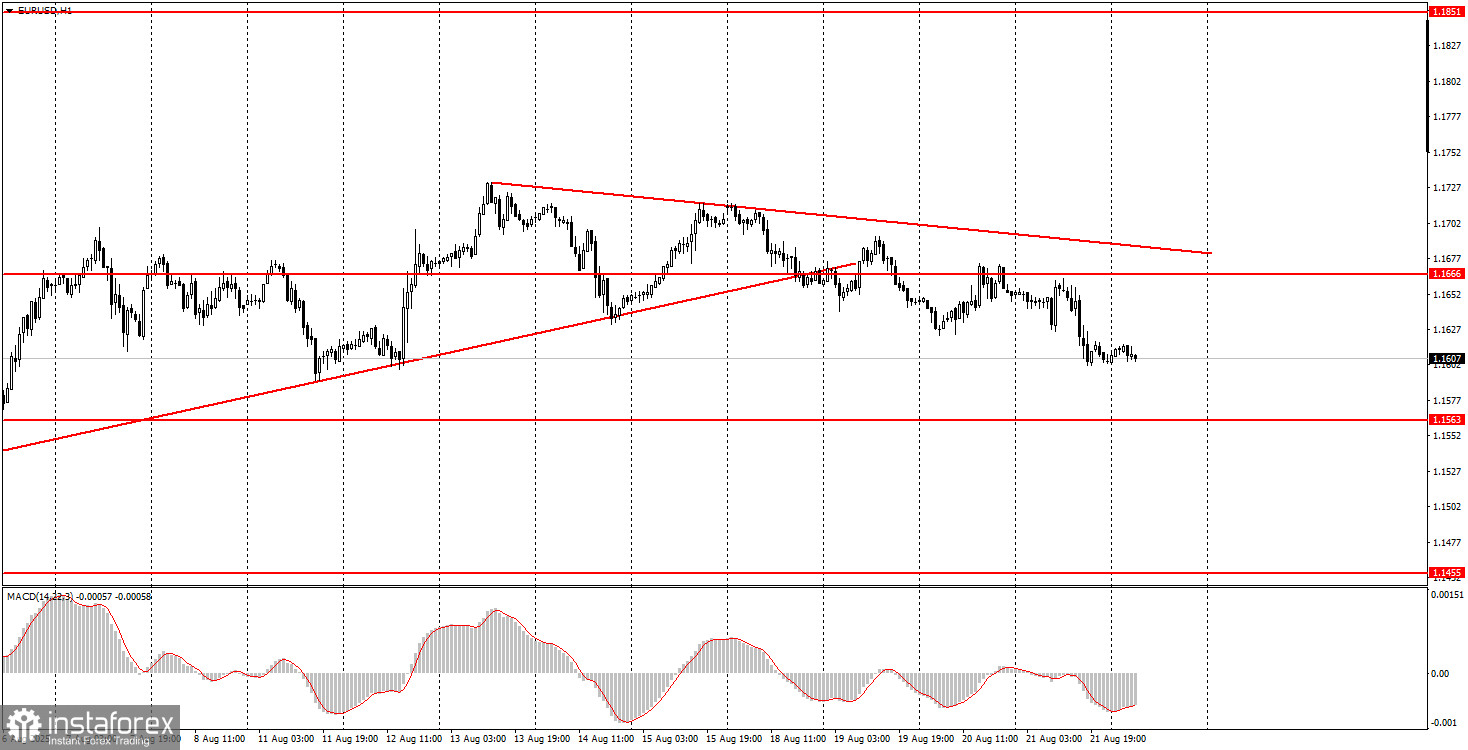
On Thursday, the EUR/USD pair continued a very weak downward move, which looks more like a flat than a trend. We have repeatedly warned novice traders that the euro is currently in a sideways phase and correcting. As we can see, the market still shows no genuine desire to buy the dollar. Yesterday was the first day this week when at least some macroeconomic data was released. However, it had no real impact on trading. German and EU business activity indices contradicted each other, while the US business activity indices, combined with the new home sales report, showed positive dynamics. But these reports are of low significance, so the dollar strengthened slightly in the second half of the day, though only marginally. We expect the main upward trend to resume. A breakout above the trendline will signal the end of yet another vague correction.
5M Chart of EUR/USD
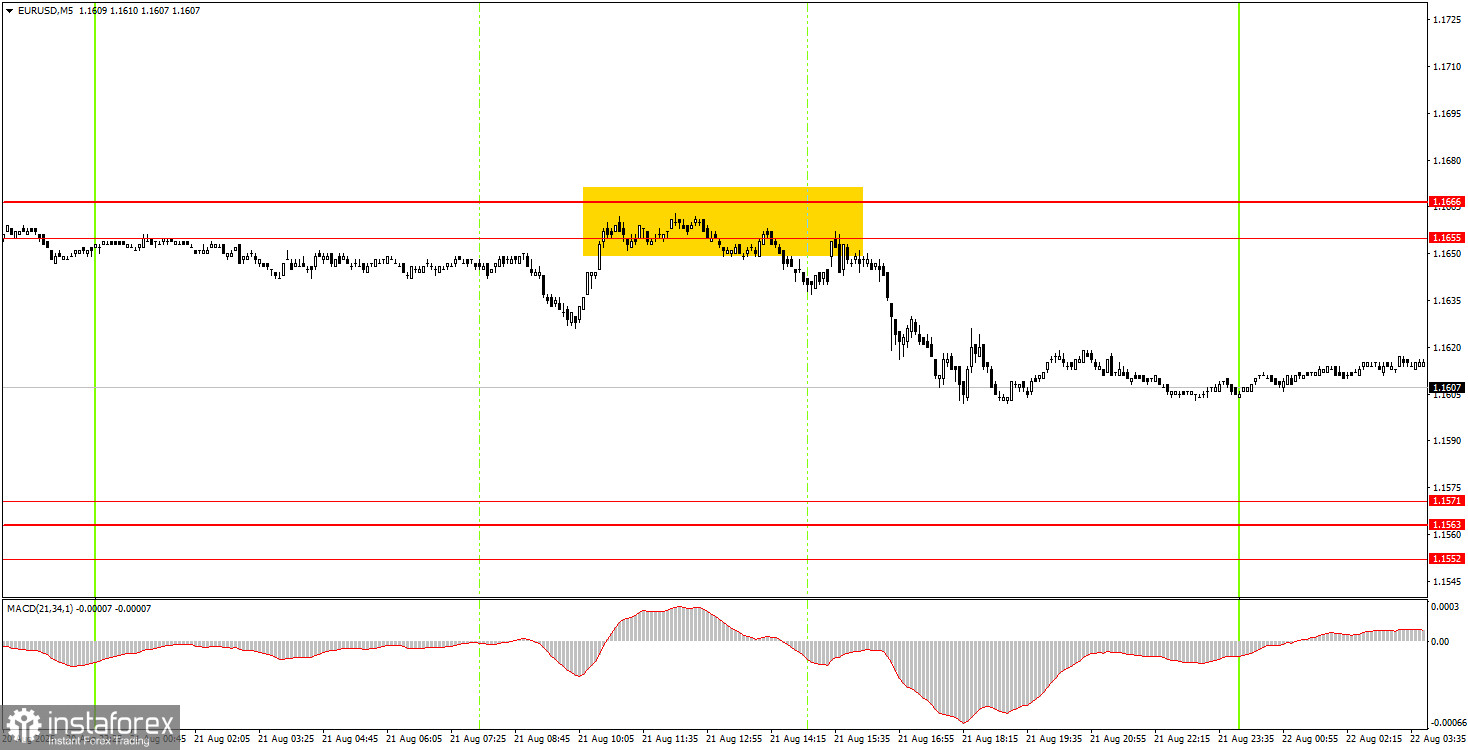
On the 5-minute timeframe, one very good sell signal was formed on Thursday. Despite the flat, the price managed to test the 1.1655–1.1666 area and rebound clearly from it. Therefore, sell trades could have been opened. After this signal formed, the price managed to move down about 25–30 pips.
Trading Strategy for Friday:
On the hourly timeframe, the EUR/USD pair has every chance to continue the upward trend that has been developing since the start of this year. However, the market is currently in a sideways range, so it is necessary to wait for it to end. We still see no grounds for a medium-term strengthening of the US currency, so we believe the dollar can only count on minor technical corrections.
On Friday, the EUR/USD pair may remain in a flat range with a slight downward bias. Trading can be done from the 1.1655–1.1666 area or the 1.1552–1.1571 area. It should be noted that Jerome Powell's speech is scheduled for the evening, making it impossible to predict the market's reaction to this event.
On the 5-minute timeframe, the following levels should be considered: 1.1198–1.1218, 1.1267–1.1292, 1.1354–1.1363, 1.1413, 1.1455–1.1474, 1.1527, 1.1552–1.1563–1.1571, 1.1655–1.1666, 1.1740–1.1745, 1.1808, 1.1851, 1.1908. On Friday, no important reports are scheduled in the Eurozone or the US, but Jerome Powell's speech at Jackson Hole will take place in the evening. Thus, volatility may increase later in the day.
Core Trading System Rules:
- Signal Strength: The shorter the time it takes for a signal to form (a rebound or breakout), the stronger the signal.
- False Signals: If two or more trades near a level result in false signals, subsequent signals from that level should be ignored.
- Flat Markets: In flat conditions, pairs may generate many false signals or none at all. It's better to stop trading at the first signs of a flat market.
- Trading Hours: Open trades between the start of the European session and the middle of the US session, then manually close all trades.
- MACD Signals: On the hourly timeframe, trade MACD signals only during periods of good volatility and a clear trend confirmed by trendlines or trend channels.
- Close Levels: If two levels are too close (5–20 pips apart), treat them as a support or resistance zone.
- Stop Loss: Set a Stop Loss to breakeven after the price moves 15 pips in the desired direction.
Key Chart Elements:
Support and Resistance Levels: These are target levels for opening or closing positions and can also serve as points for placing Take Profit orders.
Red Lines: Channels or trendlines indicating the current trend and the preferred direction for trading.
MACD Indicator (14,22,3): A histogram and signal line used as a supplementary source of trading signals.
Important Events and Reports: Found in the economic calendar, these can heavily influence price movements. Exercise caution or exit the market during their release to avoid sharp reversals.
Forex trading beginners should remember that not every trade will be profitable. Developing a clear strategy and practicing proper money management are essential for long-term trading success.