 English
  Русский
 Bahasa Indonesia
 Bahasa Malay
 ไทย
ไทย Español
 Deutsch
 Български
 Français
 Tiếng Việt
 中文
中文 বাংলা
বাংলা हिन्दी
 Čeština
 Українська
 Română

On Thursday, the EUR/USD pair consolidated below the support zone of 1.1637–1.1645, and by Friday morning it reached the 50.0% retracement level at 1.1590. Fixing below this level will increase the likelihood of a further decline toward the next Fibonacci level of 38.2% at 1.1544, and further down to 1.1486. A rebound from the 1.1590 level would work in favor of the European currency and a modest rise toward the 1.1637–1.1645 zone.
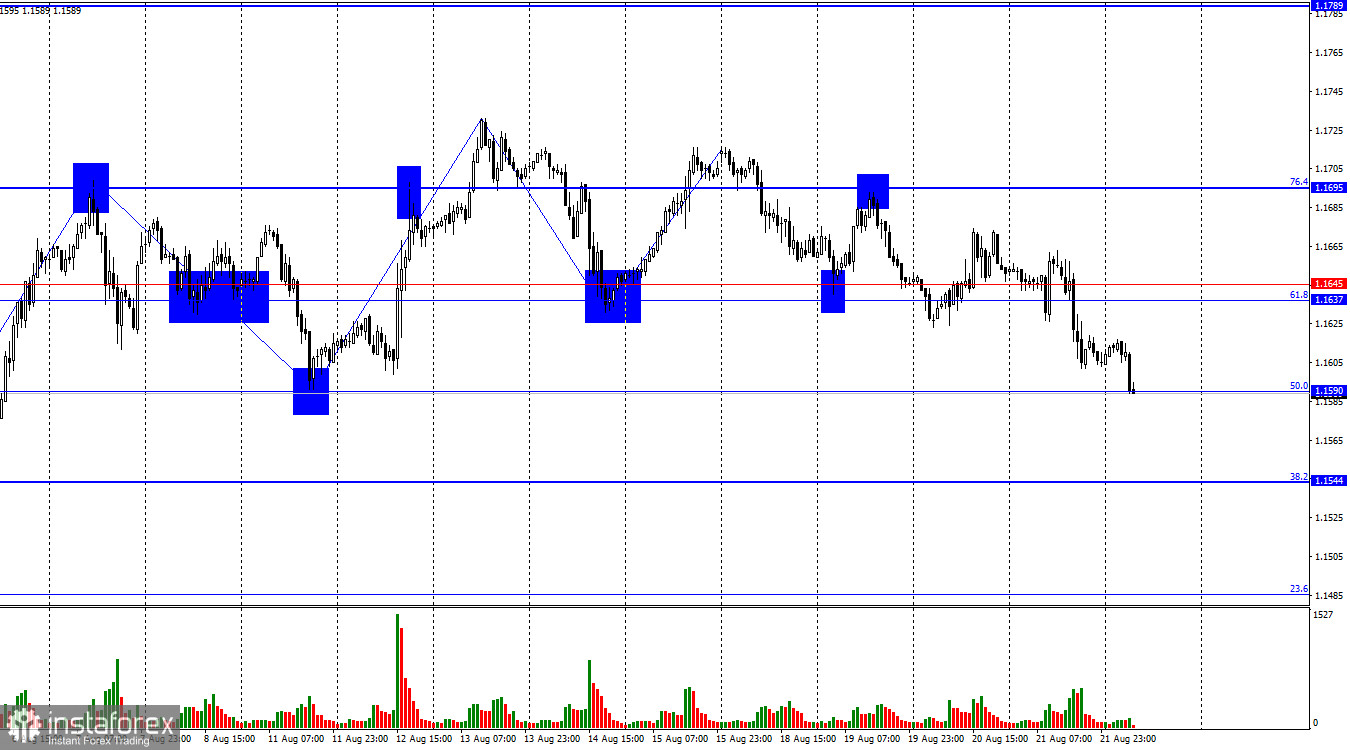
The wave pattern on the hourly chart remains simple and clear. The last completed upward wave failed to surpass the peak of the previous wave, while the last downward wave broke below the previous low. Thus, the trend may now shift to a new "bearish" phase. The latest labor market data and changing Fed monetary policy prospects support the bulls, but today Jerome Powell's speech is in focus, and traders are cautious.
On Thursday, there were plenty of economic data releases, but they did not help traders much in deciding their course of action. I believe the current decline in quotes is more tied to Powell's evening speech in Jackson Hole. Yesterday's business activity indices in Germany and the EU did not provide a clear answer as to whether activity is rising or falling. Growth in one sector was offset by a decline in another. Therefore, I believe the market has concentrated its attention on this evening's event and expects "hawkish" rhetoric from the FOMC chair. This conclusion is supported by the latest Fed minutes, which clearly indicated that inflation remains a more important factor for the regulator than the labor market. Thus, it is possible that most traders are once again mistaken in expecting monetary easing in September. Even if the FOMC decides to lower the interest rate, this does not necessarily mean that it will continue to ease policy in subsequent meetings. In my view, actual changes in monetary policy until the end of the year will be less "dovish" than most traders expect.
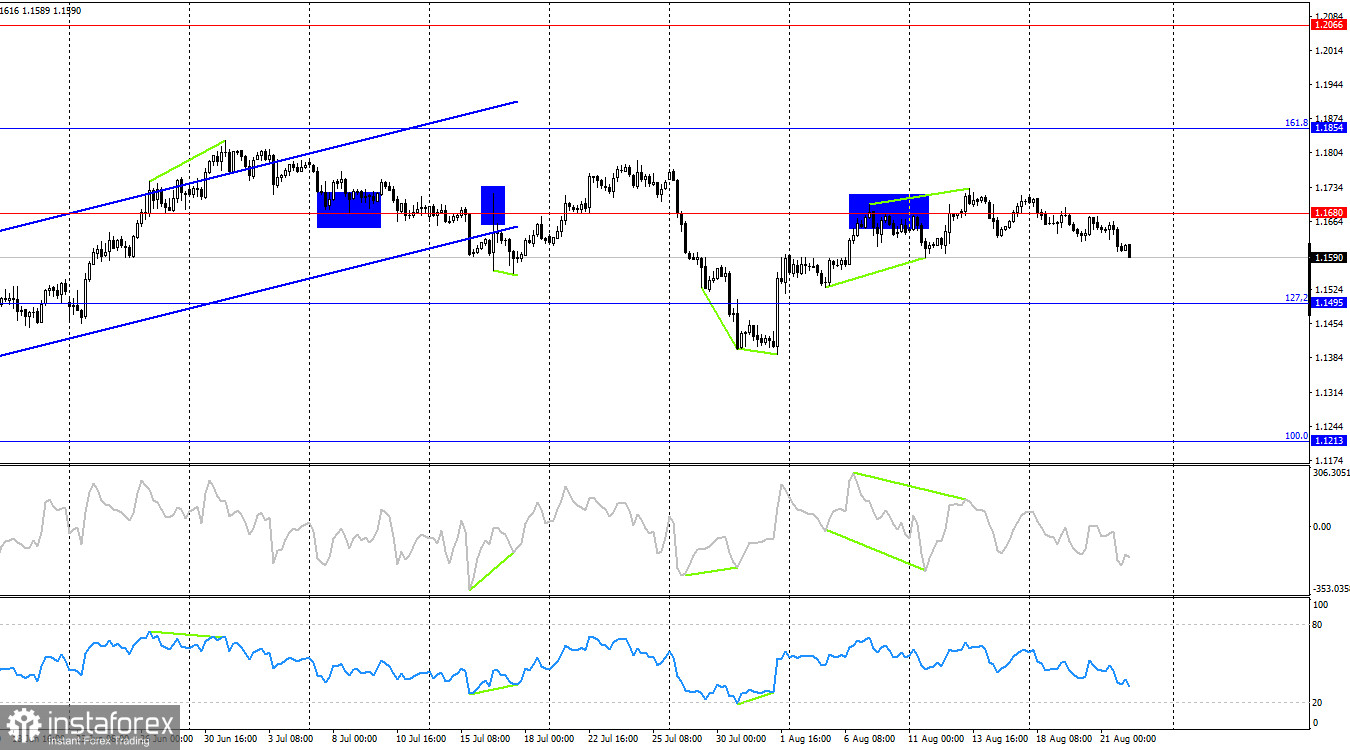
On the 4-hour chart, the pair made another reversal in favor of the U.S. currency and consolidated below the 1.1680 level. Recently, this level has been frequently crossed by price, so I do not recommend using it as a reference point. The hourly chart offers a clearer and more informative picture, with more relevant levels. No divergences are forming on any indicator today.
Commitments of Traders (COT) Report:
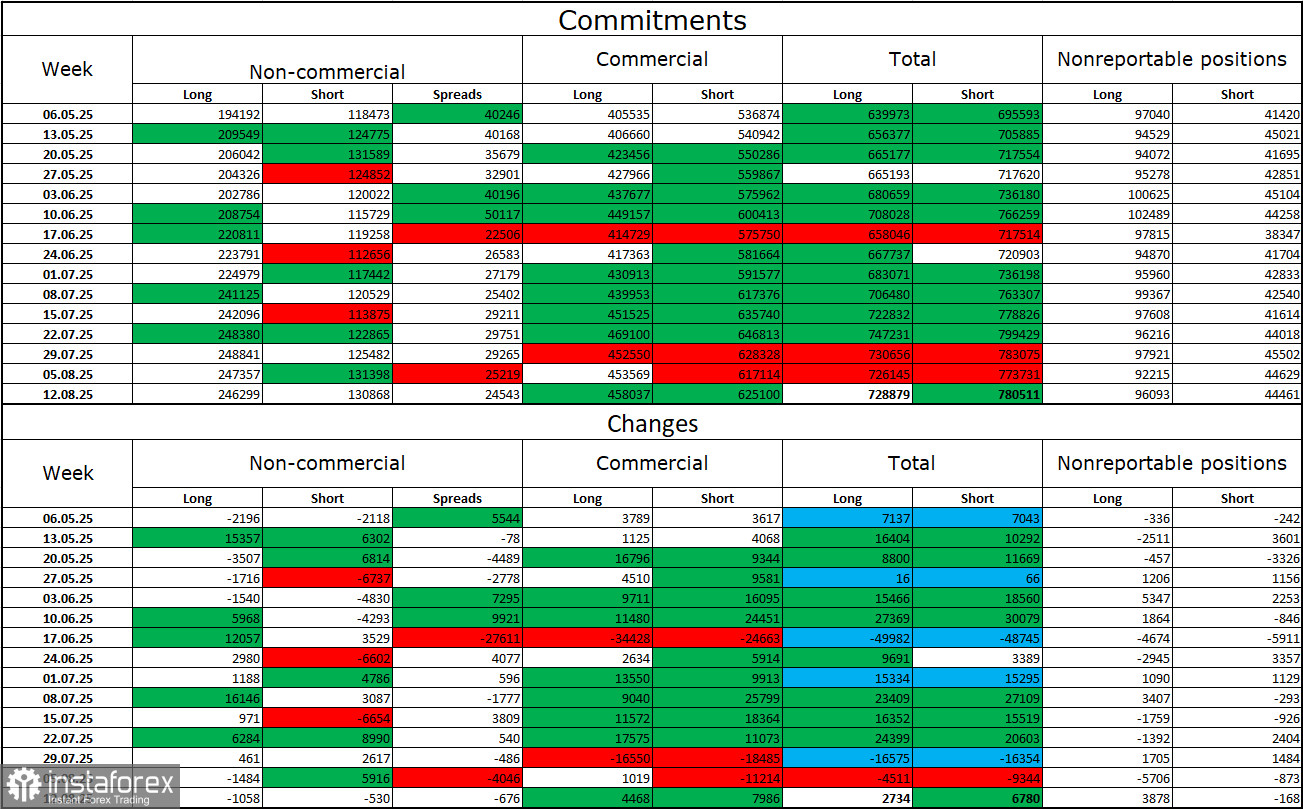
During the last reporting week, professional players closed 1,058 long positions and 530 short positions. The sentiment of the "Non-commercial" group remains "bullish" thanks to Donald Trump and continues to strengthen over time. The total number of long positions held by speculators now stands at 246,000, while short positions amount to 131,000 — almost a twofold gap. Also, note the number of green cells in the table above. They indicate strong accumulation of euro positions. In most cases, interest in the euro continues to grow, while interest in the dollar is declining.
For 27 consecutive weeks, large players have been reducing short positions and increasing longs. Donald Trump's policy remains the most significant factor for traders, as it may create many long-term and structural problems for America. Despite the signing of several important trade agreements, some key economic indicators are showing a decline.
News calendar for the U.S. and the EU:
United States – Speech by FOMC Chair Jerome Powell (14:00 UTC).
On August 22, the economic calendar contains only one entry, but this entry is the most important of the week. The impact of the news background on market sentiment Friday may be strong in the second half of the day.
EUR/USD forecast and trader recommendations:
Sales of the pair were possible after closing below the 1.1637–1.1645 zone with a target of 1.1590. This target has been reached. Closing below this level allows holding sell positions with targets at 1.1544 and 1.1486. Purchases can be opened on a rebound from 1.1590 (or another support level) on the hourly chart with targets at 1.1637–1.1645 and 1.1695.
Fibonacci levels are drawn from 1.1789–1.1392 on the hourly chart and from 1.1214–1.0179 on the 4-hour chart.