 English
  Русский
 Bahasa Indonesia
 Bahasa Malay
 ไทย
ไทย Español
 Deutsch
 Български
 Français
 Tiếng Việt
 中文
中文 বাংলা
বাংলা हिन्दी
 Čeština
 Українська
 Română


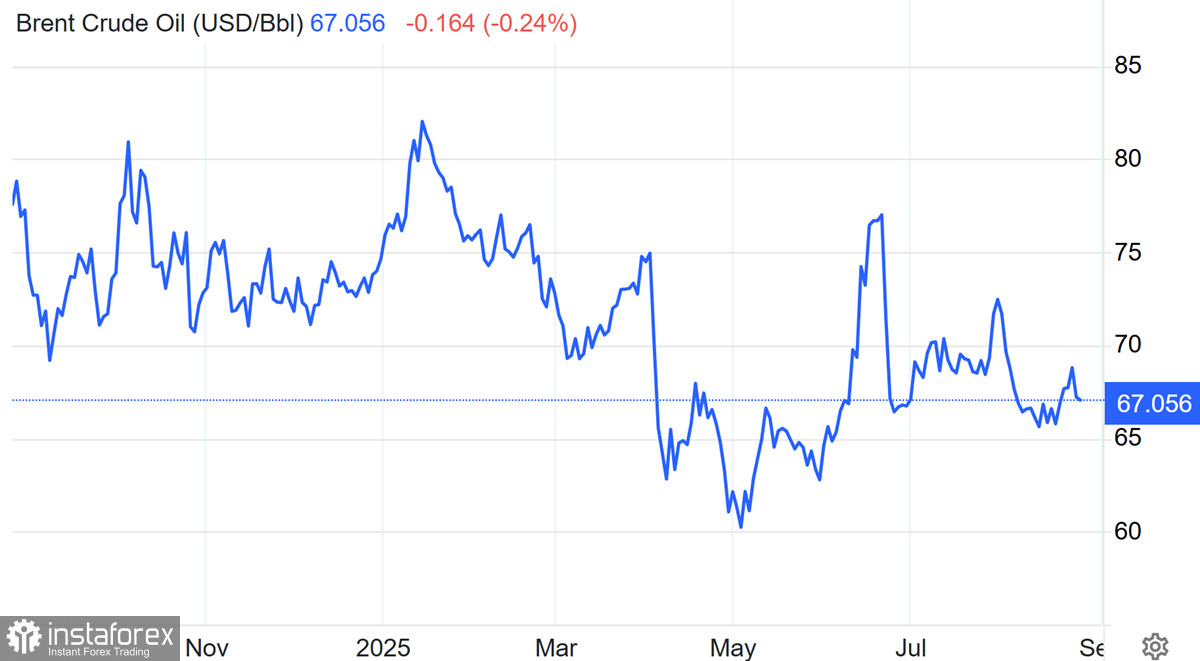
Brent crude prices fluctuated around $67 per barrel on Wednesday, holding onto more than a 2% drop from the previous session. Investors were weighing ongoing uncertainties amid geopolitical risks and trade tensions.
Brent has once again pulled back, failing to break through a key resistance zone. Technically, the market remains in a downtrend, and fundamentals continue to offer little support for the bulls.
Starting today, secondary US tariffs on Indian goods have come into effect — imposed as a penalty for India's ongoing purchases of Russian oil. However, the move appears mostly symbolic: market reaction has been minimal, and Indian refineries have not scaled back their purchases, viewing the 50% tariff as manageable — especially compared to the previously floated threat of 500%.
Geopolitical pressure is also easing. Despite Donald Trump's tough talk about a "financial war" if the conflict drags on, the news flow increasingly signals movement toward negotiations and possible resolution. This suggests a narrowing of the risk premium, which had previously supported oil prices.
Additional pressure is coming from revised Russian export plans: shipments from western ports in August have been increased by 200,000 barrels per day, adding to global supply.
On top of that, Goldman Sachs has forecast Brent at $50 by the end of next year, which is contributing to a long-term bearish mood among investors.
In the short term, US inventory data remains the key driver. The API reported a 1 million barrel draw, along with declines in gasoline and distillate stocks.
If EIA numbers due in the evening confirm this trend, the market could get brief support from the demand side — but overall, the broader picture still leans toward oversupply.
Oil: technical picture
Brent is trading below the resistance zone and continues to correct lower. A recent attempt to hold above the descending trendline turned out to be a false breakout. Now, the focus shifts to key support levels: $66.6 and $65.0 are the nearest zones where a local bounce may form.
If those levels break, the path to $63.7 will open quickly, plunging the market back to three-month lows. For bulls to regain control, it's not enough to reclaim $67.9 — the price would also need to break through $69.2–69.5, a resistance corridor leading to the 200-day moving average at $70.5.
For now, the structure indicates a continuation of the downward impulse.
Gas: fundamental picture
Natural gas prices hit new lows not seen since November last year, falling to $2.65 per MMBtu. The pressure remains unchanged: production in the Lower 48 is holding near a record 108.4 Bcf/day, and inventories are over 6% above seasonal norms.
Even the summer heat hasn't been strong enough to boost demand enough to reverse the situation. However, the latest week brought a smaller storage build compared to the five-year average, slightly softening the picture.
LNG exports remain stable at around 15.8 Bcf/day, but that's not enough to offset record supply. With weather forecasts through September near normal, demand factors are unlikely to become a growth driver.
In these conditions, prices remain under pressure, and any rallies are likely to be short-term corrections rather than sustained uptrends.
Gas: technical picture
One key technical element now is the gap formed between futures contracts due to the rollover between front-months. The current price action may be an attempt to close that gap and retest the broken descending resistance from above.
If the price manages to stay above $2.85–2.90, it would be the first signal of a potential breakout from the bearish channel. Until then, the base case remains intact: continued drift lower, with a test of $2.65 as key support.
If that level is lost, the market may quickly fall into the $2.55–2.60 range, where it could begin to search for a long-awaited bottom.