 English
  Русский
 Bahasa Indonesia
 Bahasa Malay
 ไทย
ไทย Español
 Deutsch
 Български
 Français
 Tiếng Việt
 中文
中文 বাংলা
বাংলা हिन्दी
 Čeština
 Українська
 Română

Trend analysis (Fig. 1).
On Thursday, from the 1.1637 level (yesterday's daily close), the market may start moving downward, targeting 1.1594 – the 50% retracement level (yellow dotted line). Upon testing this level, the price may rebound upward, aiming for 1.1640 – the 61.8% retracement level (yellow dotted line).
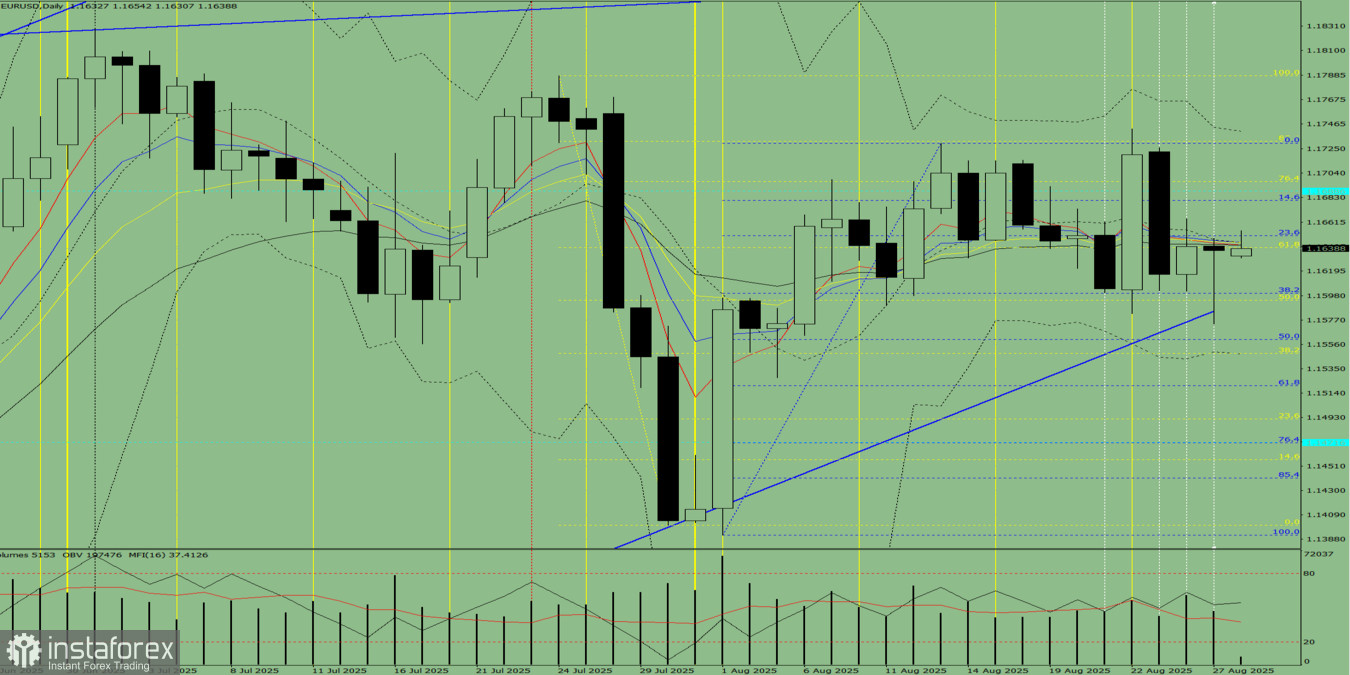
Fig. 1 (daily chart).
Comprehensive analysis:
- Indicator analysis – downward;
- Fibonacci levels – downward;
- Volumes – downward;
- Candlestick analysis – downward;
- Trend analysis – downward;
- Bollinger Bands – downward;
- Weekly chart – downward.
Overall conclusion: downward trend.
Alternative scenario: On Thursday, from the 1.1637 level (yesterday's daily close), the market may start moving downward, targeting 1.1560 – the 50% retracement level (blue dotted line). Upon testing this level, the price may rebound upward, aiming for 1.1594 – the 50% retracement level (yellow dotted line).