 English
  Русский
 Bahasa Indonesia
 Bahasa Malay
 ไทย
ไทย Español
 Deutsch
 Български
 Français
 Tiếng Việt
 中文
中文 বাংলা
বাংলা हिन्दी
 Čeština
 Українська
 Română

On Wednesday, the EUR/USD pair fell to the 50.0% retracement level at 1.1590, then turned in favor of the euro and returned to the resistance zone of 1.1637–1.1645. A rebound from this zone would favor the U.S. currency and a resumption of the decline toward 1.1590. Consolidation above 1.1637–1.1645 would give traders reason to expect further growth toward the 76.4% Fibonacci level at 1.1695. In recent weeks, the market has been moving sideways.
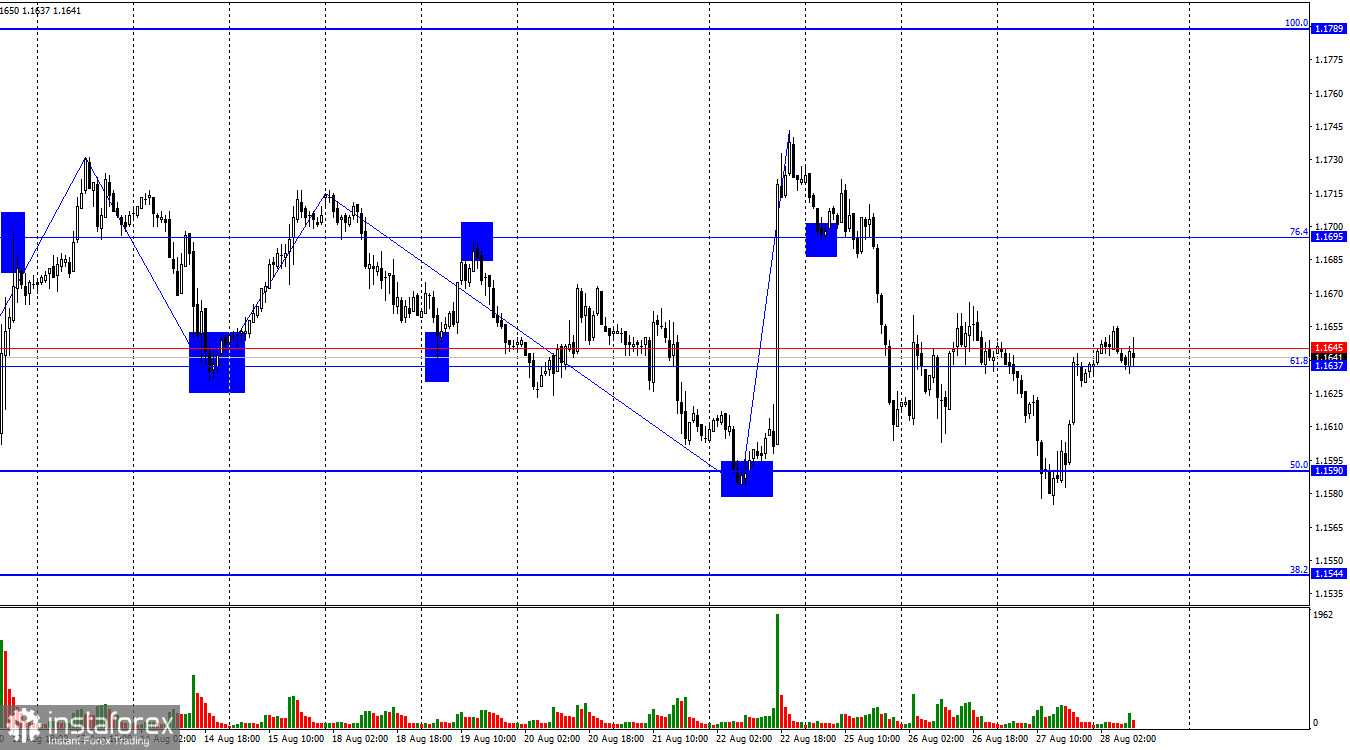
The wave picture on the hourly chart remains simple and clear. The last completed downward wave did not break the previous lows, while the last upward wave broke almost all the recent highs. Thus, the trend may once again be shifting to "bullish," though the likelihood of sideways movement remains. Recent labor market data and a shift in Fed policy outlook support the bulls.
On Wednesday, there were no economic reports. The market continued digesting news about Lisa Cook's dismissal as well as new tariffs against India. In both cases, the initiator was Donald Trump. Traders reacted calmly to these developments, though in my view, bulls had every reason to launch a new offensive. A new advance is only likely after consolidation above 1.1637–1.1645. This week, the news background is very weak, so traders may be deliberately pausing until more important information arrives. Next week will provide plenty, with U.S. labor market data being decisive for the Fed's monetary policy decision in September. Recall that traders expect a rate cut after an eight-month pause, though doubts remain, since inflation is still rising very slowly but could accelerate sharply, which would make policy easing impossible in the future.
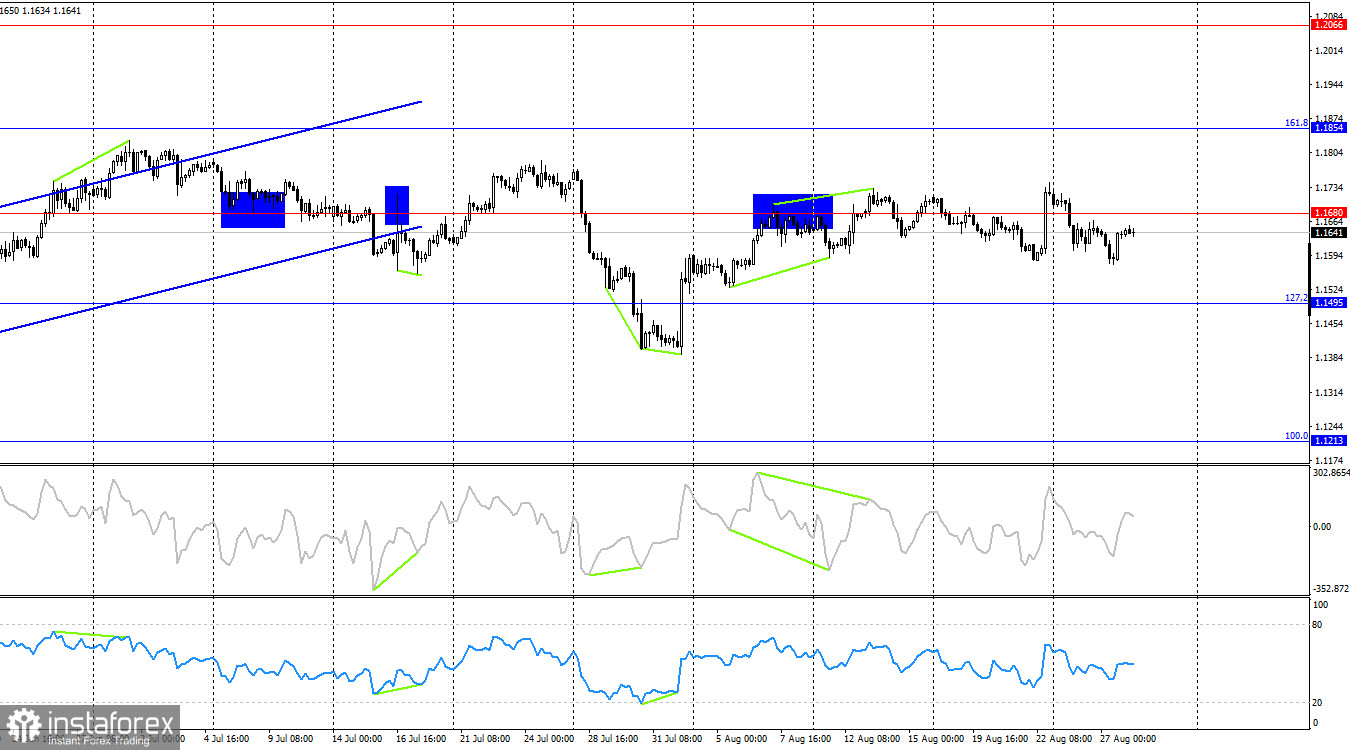
On the 4-hour chart, the pair turned again in favor of the U.S. currency and consolidated below 1.1680. Recently, this level has been crossed too often to be reliable, so I do not recommend paying attention to it. The hourly chart is much more informative and contains more levels. No emerging divergences are visible in any indicator today. The sideways pattern is also clearly seen on the 4-hour chart.
Commitments of Traders (COT) Report:
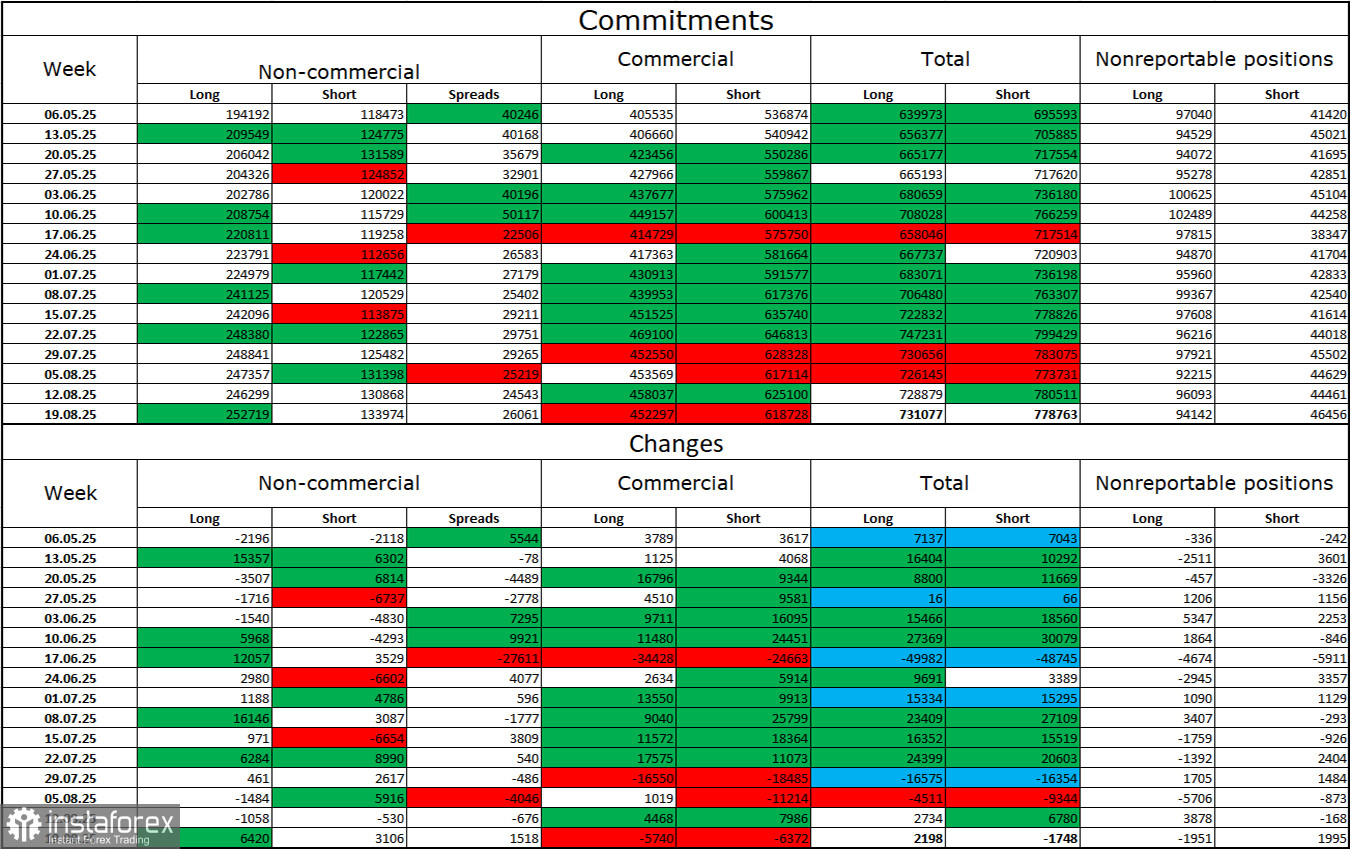
During the last reporting week, professional traders opened 6,420 long positions and 3,106 short positions. The sentiment of the "Non-commercial" group remains bullish thanks to Donald Trump and is strengthening over time. The total number of long positions held by speculators now stands at 253,000 versus 134,000 shorts — nearly a twofold gap. Also note the large number of green cells in the table above, reflecting strong increases in euro positions. In most cases, interest in the euro keeps growing, while interest in the dollar declines.
For 28 consecutive weeks, large players have been reducing shorts and increasing longs. Trump's policies remain the most significant factor for traders, as they may cause long-term structural problems for the U.S. economy. Despite several important trade deals being signed, some key economic indicators continue to show declines.
News calendar for the U.S. and the Eurozone:
- U.S. – Q2 GDP change (12:30 UTC)
- U.S. – Initial jobless claims (12:30 UTC)
On August 28, the economic calendar contains two entries, neither of which is particularly important. The news background on Thursday will have little to no influence on market sentiment.
Forecast for EUR/USD and trader recommendations:
Sales were possible after a close below 1.1695 on the hourly chart, with a target at the 1.1637–1.1645 zone. The next target at 1.1590 was also achieved, but the market is currently in a sideways phase. Buys were possible from a rebound at 1.1590 on the hourly chart, with a target at 1.1695. Today, these trades can remain open as long as consolidation occurs above 1.1637–1.1645.
Fibonacci grids are built from 1.1789–1.1392 on the hourly chart and from 1.1214–1.0179 on the 4-hour chart.