 English
  Русский
 Bahasa Indonesia
 Bahasa Malay
 ไทย
ไทย Español
 Deutsch
 Български
 Français
 Tiếng Việt
 中文
中文 বাংলা
বাংলা हिन्दी
 Čeština
 Українська
 Română

The EUR/USD currency pair traded relatively quietly throughout Tuesday—at least until the publication of the annual Nonfarm Payrolls report. However, as we've said many times, one report (no matter what it is) cannot reverse the trend or instantly change trader sentiment. That's why in our fundamental articles, we won't even discuss the NonFarm Payrolls report; we'll cover it in the "Trading Recommendations" section.
After a three-week pause, the US dollar is falling again. As we warned several times over these last three weeks, the dollar had—and still has—no factors for growth. If anything, quite the opposite. In these three weeks, enough news arrived essentially "instructing" the market to keep dumping the US currency. This includes failed macroeconomic statistics in the US, Donald Trump's "firing" of Lisa Cook, and the raising of tariffs against India in retaliation for their refusal to stop buying Russian oil, gas, and arms. As we can see, the trade war is only escalating, with Trump now using tariffs as leverage against certain countries to achieve his own geopolitical goals, while still demanding the Fed cut rates.
Therefore, all the factors that pushed the dollar down in the first 7–8 months of 2025 remain in force. But beyond those, there are new ones as well. For example, starting in September, the gap between ECB and Fed rates will begin to narrow—and we expect it to narrow quickly. In theory, the euro shouldn't have risen so much in the first half of the year, since the ECB was cutting rates that whole time. Imagine how powerful Trump's impact on the dollar was, that even as the ECB was easing, the euro still rose! In the second half, the Fed will be the one cutting rates. So what should we expect from the dollar if it fell even when the Fed kept hawkish policy settings?
Regarding Trump's influence on the dollar, it's clear that under Trump, the US currency has consistently depreciated and will likely continue to do so for another 3.5 years. But there is another important point: the share of dollar reserves at central banks worldwide is declining. This has been happening for quite some time—so you can't solely blame Trump for it—but he could worsen the trend. As of 2024, the US dollar's share of reserves is 57.8%, the euro about 20%, and all other currencies about 20%. Obviously, it will take a very long time for the euro and the dollar to reach parity, but the process has begun and has been ongoing for at least a decade.
Trump himself doesn't want the world to abandon the dollar, but US protectionist policies are leading it there. We see the Asia-Pacific region cooperating, strengthening ties, uniting against the US. The trio of India-China-Russia can hardly be called "weak players"—even individually, they are quite powerful. Who will the US cooperate with? Canada and the EU, both of which have been hit with tariffs.
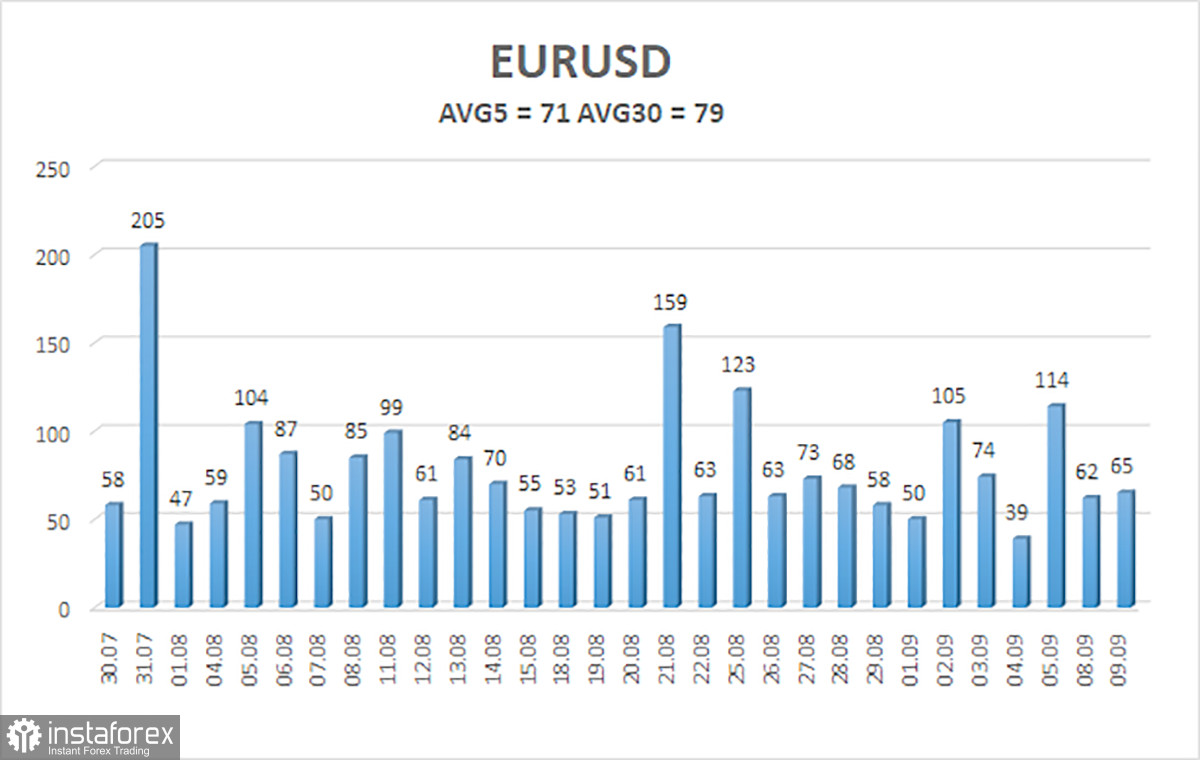
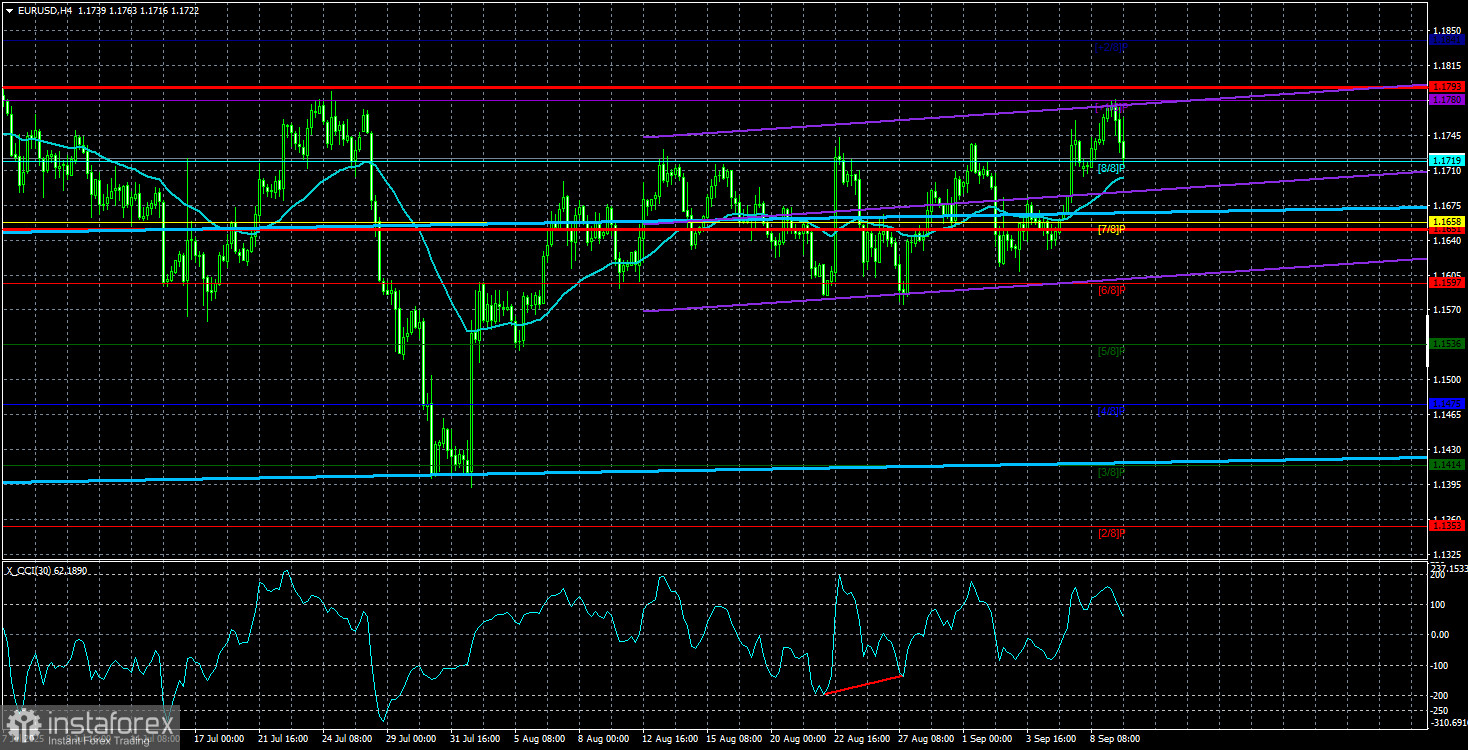
The average volatility of the EUR/USD pair over the last five trading days as of September 10 is 71 pips, characterized as "average." We expect the pair to move between 1.1651 and 1.1793 on Wednesday. The linear regression channel's upper band is pointed upward, which still indicates an upward trend. The CCI indicator entered the oversold area three times, warning of a renewed uptrend. A bullish divergence also formed, signaling growth.
Nearest Support Levels:
S1 – 1.1719
S2 – 1.1658
S3 – 1.1597
Nearest Resistance Levels:
R1 – 1.1780
R2 – 1.1841
Trading Recommendations:
The EUR/USD pair may resume its uptrend. The US currency is still strongly influenced by Donald Trump's policies, and he has no intention of "resting on his laurels." The dollar has risen as much as it could, but now it seems time for a new round of prolonged decline. If the price is below the moving average, small shorts to a target of 1.1597 can be considered. Above the moving average, long positions remain relevant with targets at 1.1780 and 1.1841 in continuation of the trend.
Chart Elements Explained:
- Linear regression channels help determine the current trend. If both channels point in the same direction, the trend is strong.
- The moving average line (settings 20,0, smoothed) indicates the short-term trend and trade direction.
- Murray levels serve as target levels for moves and corrections.
- Volatility levels (red lines) are the likely price channel for the next day, based on current volatility readings.
- The CCI indicator: dips below -250 (oversold) or rises above +250 (overbought) mean a trend reversal may be near.