 English
  Русский
 Bahasa Indonesia
 Bahasa Malay
 ไทย
ไทย Español
 Deutsch
 Български
 Français
 Tiếng Việt
 中文
中文 বাংলা
বাংলা हिन्दी
 Čeština
 Українська
 Română

Trade review and tips for trading the Japanese yen
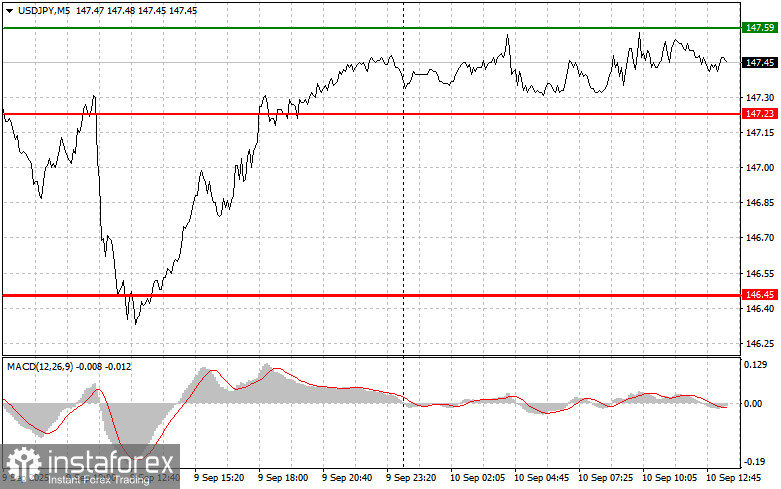
The levels I indicated were not tested during the first half of the day. Low market volatility ahead of key data discouraged traders from acting more actively.
This afternoon, August U.S. Producer Price Index (PPI) data will be released, including both the headline index and the version excluding volatile categories such as food and energy. A report on changes in wholesale inventories will also be published. These reports will serve as key indicators of inflationary trends in the U.S. economy and will strongly influence the Federal Reserve's next steps in monetary policy.
Particular attention is paid to the core PPI, as it excludes highly volatile categories such as food and energy. Its dynamics will help provide a clearer picture of underlying inflation and how it translates into consumer prices. Data on wholesale inventories will help assess the balance between supply and demand across various consumer markets. An increase in inventories may signal slower economic expansion, while a decrease points to stronger consumer demand. The release of this data will have a significant impact on the U.S. dollar.
As for intraday strategy, I will rely more on scenarios No. 1 and No. 2.
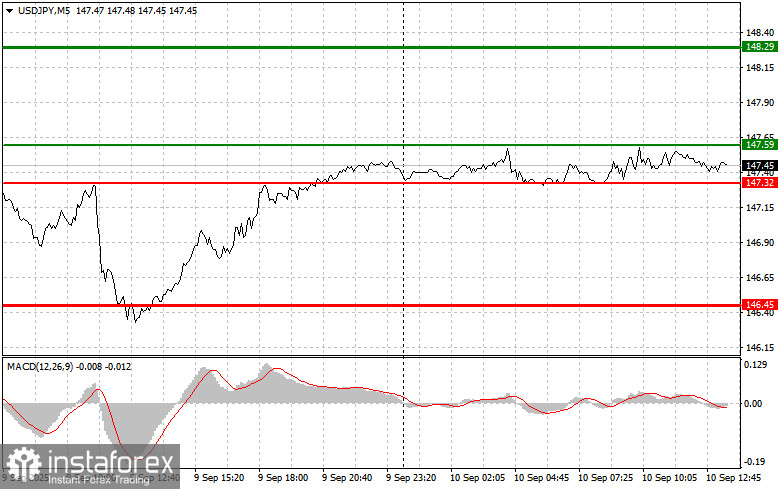
Buy signal
Scenario No. 1: Today, I plan to buy USD/JPY at the entry point around 147.59 (green line on the chart) with the target of rising to 148.29 (thicker green line on the chart). Around 148.29, I will exit purchases and open sales in the opposite direction (expecting a 30–35 point reversal from the level). A rise in the pair will only be possible after strong data.Important! Before buying, make sure the MACD indicator is above the zero line and has just started to rise from it.
Scenario No. 2: I also plan to buy USD/JPY if the price of 147.32 is tested twice in a row, at a time when the MACD indicator is in oversold territory. This will limit the downward potential of the pair and lead to a reversal upward. Growth toward the opposite levels of 147.59 and 148.29 can then be expected.
Sell signal
Scenario No. 1: Today, I plan to sell USD/JPY after the level of 146.18 (red line on the chart) is updated, which will lead to a quick decline of the pair. The key target for sellers will be 145.61, where I will exit sales and immediately open purchases in the opposite direction (expecting a 20–25 point reversal from the level). Pressure on the pair will return today in case of weak data.Important! Before selling, make sure the MACD indicator is below the zero line and has just started to decline from it.
Scenario No. 2: I also plan to sell USD/JPY if the price of 146.74 is tested twice in a row, at a time when the MACD indicator is in overbought territory. This will limit the upward potential of the pair and lead to a reversal downward. A decline toward the opposite levels of 146.18 and 145.61 can then be expected.
What's on the chart:
- Thin green line – entry price for buying the instrument;
- Thick green line – estimated level to place Take Profit or lock in profit manually, as further growth above this level is unlikely;
- Thin red line – entry price for selling the instrument;
- Thick red line – estimated level to place Take Profit or lock in profit manually, as further decline below this level is unlikely;
- MACD indicator – when entering the market, it is important to consider overbought and oversold zones.
Important. Beginner Forex traders must be very cautious when making entry decisions. Before major fundamental reports are released, it is best to stay out of the market to avoid sudden price swings. If you decide to trade during news releases, always place stop-loss orders to minimize losses. Without stop-losses, you can very quickly lose your entire deposit, especially if you don't use money management and trade with large volumes.
And remember: for successful trading you must have a clear trading plan, like the one presented above. Spontaneous trading decisions based only on the current market situation are, from the outset, a losing strategy for an intraday trader.