 English
  Русский
 Bahasa Indonesia
 Bahasa Malay
 ไทย
ไทย Español
 Deutsch
 Български
 Français
 Tiếng Việt
 中文
中文 বাংলা
বাংলা हिन्दी
 Čeština
 Українська
 Română

EUR/USD 5-Minute Analysis
The EUR/USD pair posted completely illogical moves on Tuesday and Wednesday. On Tuesday, following the release of the annual NonFarm Payrolls report (which, unsurprisingly, disappointed), the US dollar rose. Then on Wednesday, when the dollar had every chance to fall again, there was no decline in the US currency—even though the Producer Price Index showed a drop of 0.1%. Historically, the PPI figure is usually around 0.2–0.3%. The slowdown could indicate simply a correction after the previous month's surge (when prices rose by 0.9%), as well as the minimal impact of Donald Trump's tariffs on inflation. However, low inflation still (potentially) implies an even more dovish attitude from the Fed at next week's meeting.
Tomorrow brings the ECB meeting, but traders shouldn't expect much. The ECB has effectively ended its rate-cutting cycle, having achieved its target inflation level. Given that global trade wars may slightly accelerate inflation in the near term, even within the EU, the central bank is unlikely to cut rates or signal a decrease soon. Again, this works in the euro's favor. Thus, we continue to expect only further growth from the single currency.
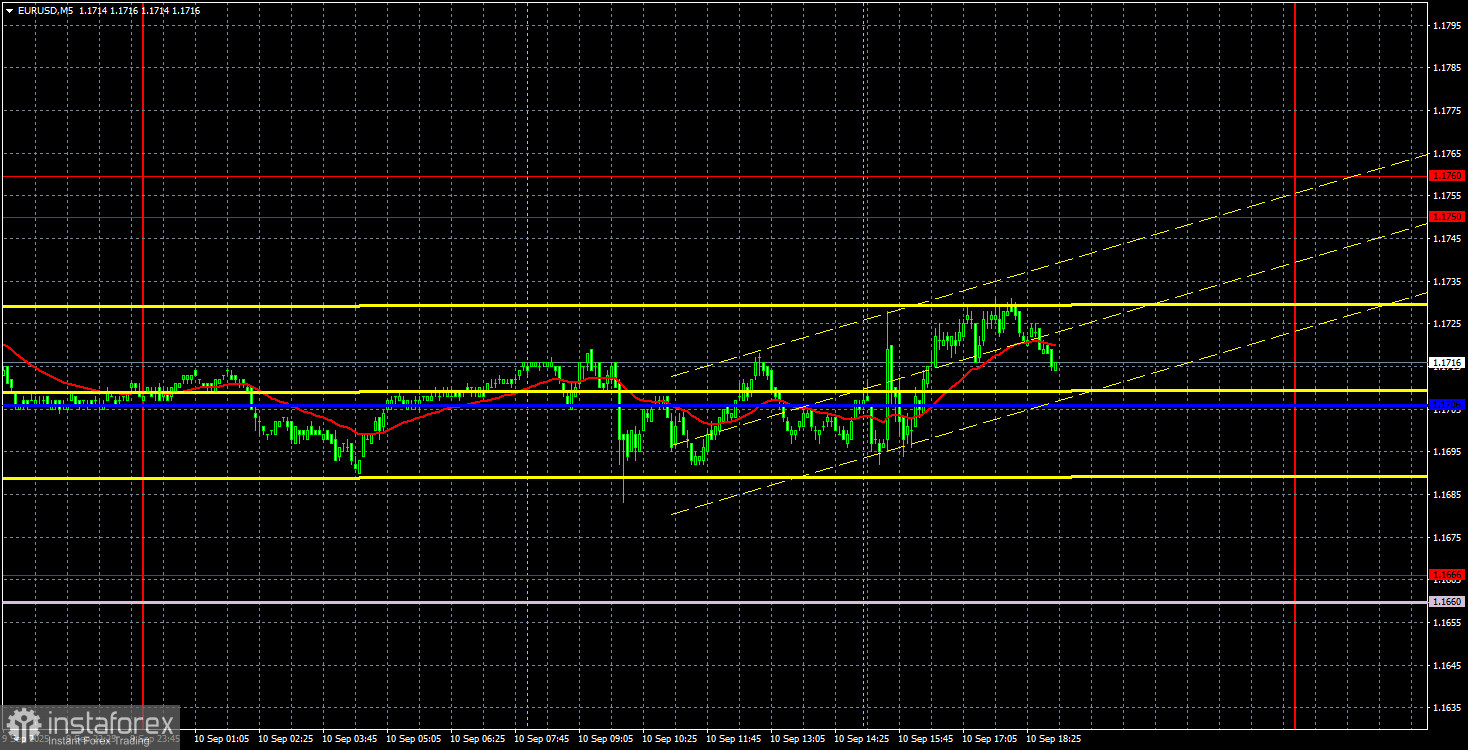
On the 5M timeframe, there was a total flat market and low volatility yesterday. There was no sense in trading, even though traders might have tried to trade the initial signals near the critical line. But by the US session, it became clear that there would be no real moves or solid signals.
COT Report
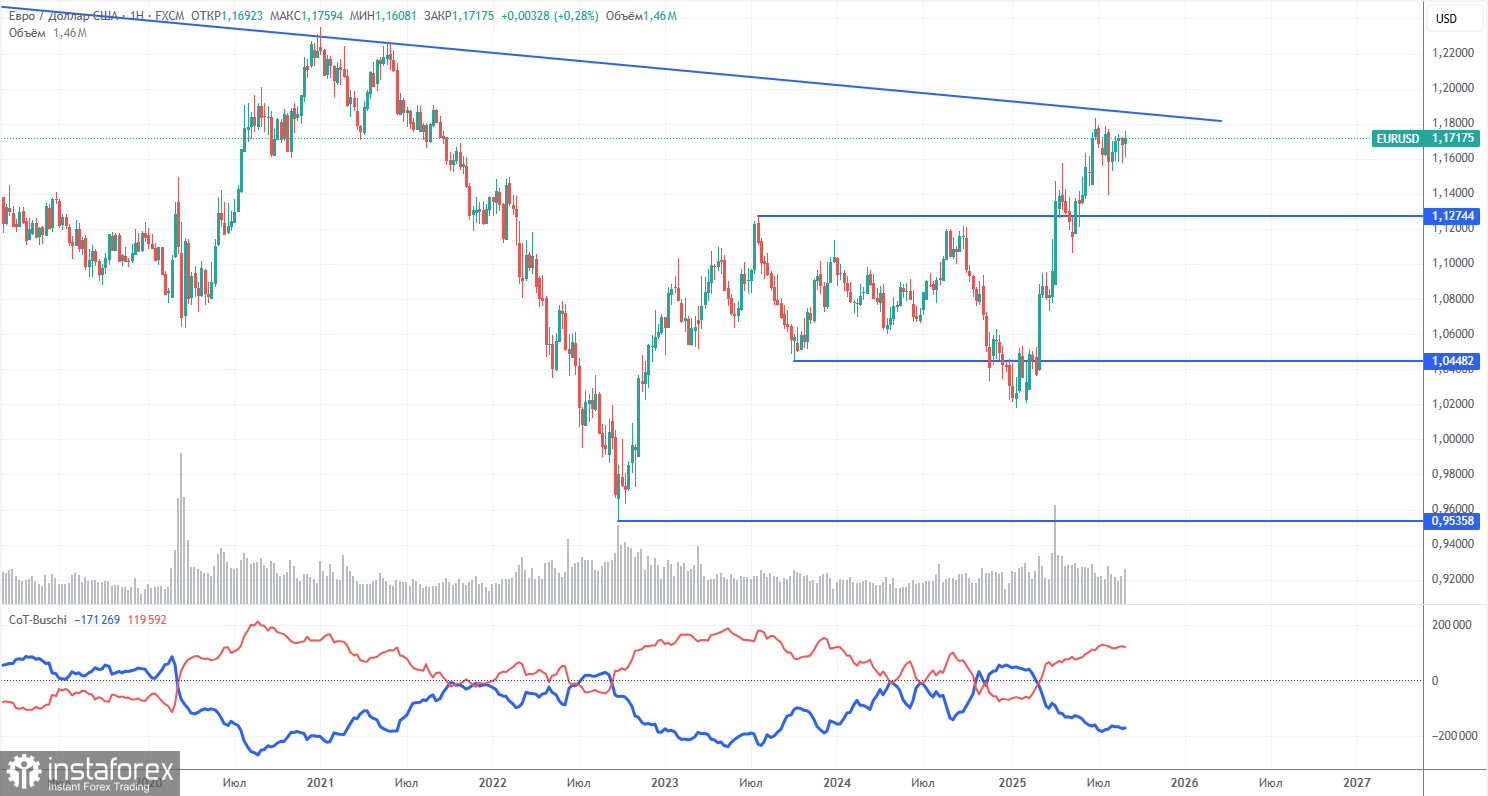
The latest COT report is dated September 2. The chart above clearly shows that the net position of non-commercial traders was bullish for a long time, and bears only tenuously took control at the end of 2024, but quickly lost it. Since Trump became the US president, the dollar has been the only currency to fall. We can't say with 100% certainty that the US dollar's decline will continue, but current world events point precisely in that direction.
We still see no fundamental factors for strengthening the euro, but there remain plenty of reasons for the dollar to decline. The global downtrend remains intact, but does it matter where the price has moved over the last 17 years? Once Trump ends his trade wars, the dollar may go up again, but recent events show that the trade war will continue in one form or another. A potential loss of Fed independence is yet another strong pressure factor on the US currency.
The positioning of the indicator's red and blue lines still shows a bullish tendency. During the last reporting week, long positions from the "Non-commercial" group decreased by 2,700, while shorts increased by 700. The net position for the week thus decreased by 3,400, which is an insignificant change.
EUR/USD 1-Hour Analysis
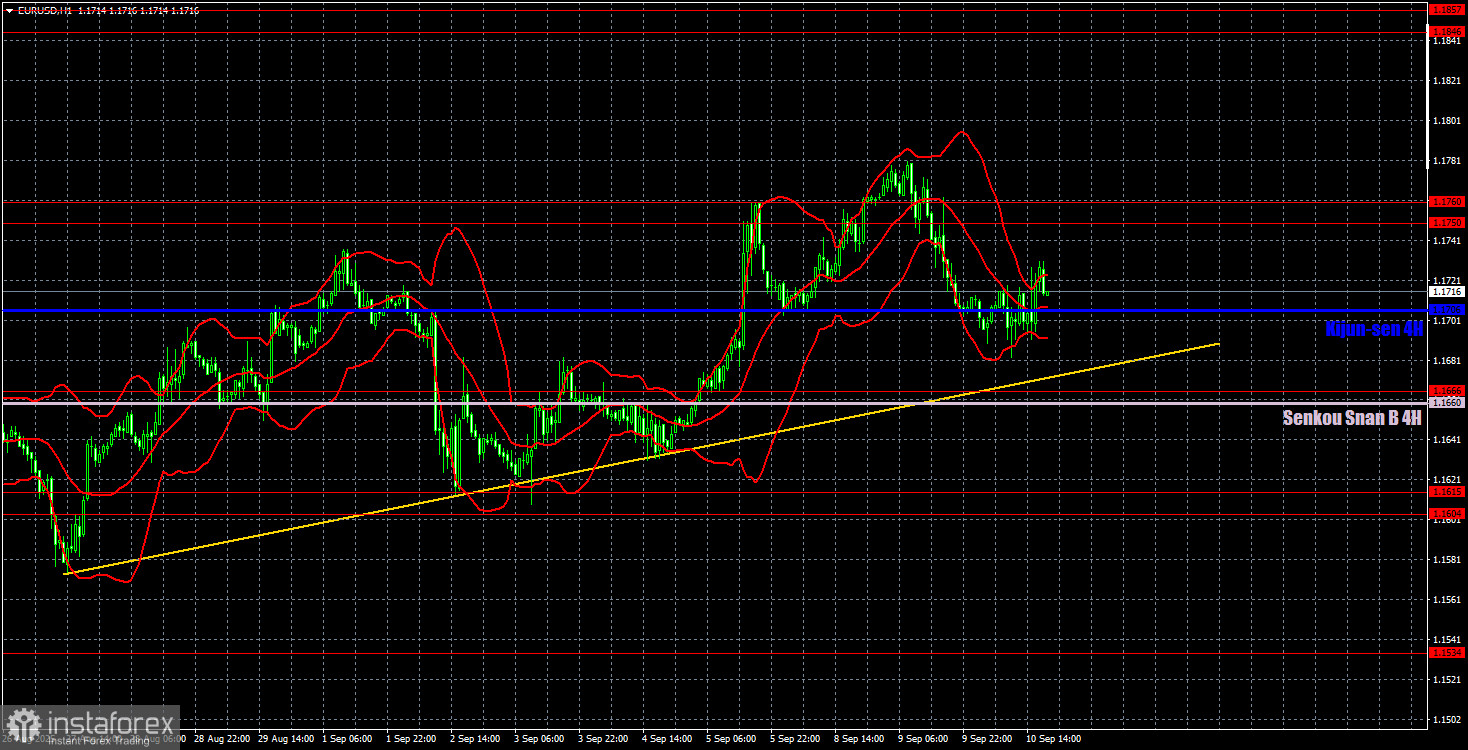
On the hourly chart, EUR/USD took the first step toward forming a new upward trend, but the market has been in a sideways flat for several weeks since. Formally, we now see a new upward trend developing, as shown by the trendline. However, the pair still spends most of its time in the 1.1615–1.1750 range. There are still plenty of negative factors for the dollar, and even this week, it could have fallen practically every day.
For September 11, we highlight the following levels for trading: 1.1092, 1.1147, 1.1185, 1.1234, 1.1274, 1.1362, 1.1426, 1.1534, 1.1604–1.1615, 1.1666, 1.1750–1.1760, 1.1846–1.1857, as well as the Senkou Span B (1.1660) and Kijun-sen (1.1706) Ichimoku lines. The Ichimoku indicator lines can move intraday, which should be considered when identifying signals. Don't forget to move the Stop Loss to breakeven if the price moves 15 pips in the right direction to avoid potential losses in case of a false signal.
On Thursday, the ECB decision will be announced in the EU, and the US will publish inflation data. Neither is expected to produce any shockwaves. Current inflation is already unlikely to influence the Fed's September 17 rate decision.
Trading Recommendations
On Thursday, the price may finally resume its upward movement, in line with the current trend, fundamentals, and macroeconomic background. Decline is possible only if the ECB maintains a dovish tone or if US inflation is low.
Illustration Explanations:
- Support and resistance price levels – thick red lines where movement may end. They are not trading signal sources.
- Kijun-sen and Senkou Span B lines—These are strong Ichimoku indicator lines transferred to the hourly timeframe from the 4-hour one.
- Extremum levels – thin red lines where the price has previously rebounded. These act as trading signal sources.
- Yellow lines – trend lines, trend channels, and other technical patterns.
- Indicator 1 on the COT charts – the size of the net position for each category of traders.