 English
  Русский
 Bahasa Indonesia
 Bahasa Malay
 ไทย
ไทย Español
 Deutsch
 Български
 Français
 Tiếng Việt
 中文
中文 বাংলা
বাংলা हिन्दी
 Čeština
 Українська
 Română

The EUR/USD currency pair is likely to continue its upward movement during the upcoming week. Making such a forecast is very easy, even for a beginner. Just open the daily chart and see where (and how fast) the pair is moving in 2025. After all, shouldn't trading follow the trend? So even if the euro dips a little next week, it won't change the overall outlook—there's simply no reason to expect dollar strength.
Remember, there are several global reasons for the dollar's decline. The first is that the "dollar trend" lasted 16–17 years, and everyone knows that everything in the economy is cyclical. For example, from 2000 to 2008, there was an "euro trend," from 1992 to 2000, a "dollar trend," and from 1985 to 1992, the euro rose. So the dollar trend has already lasted twice as long as previous cycles. You could argue it ended in 2022.
The second global factor is the sharp shift in US policy. With Donald Trump coming to power a second time, US policy became highly protectionist, with Trump seeking to establish a sort of hidden dictatorship. Put simply, America stopped being a country for everyone, a destination for investment, a "dream country." Every month, the US becomes less appealing to foreigners and foreign investment. Naturally, this weighs on the world's main currency—the dollar.
The third factor is the Federal Reserve. Remember, the Fed is, in a sense, the world's central bank—the main central bank for the global economy's key currency. The Fed is supposed to be an independent body, but in 2025–2026, it may lose its independence and become entirely subordinate to Trump. Trump has no interest in maintaining the value of the dollar or preventing its depreciation; on the contrary, he wants a cheaper dollar so America can export more, not just import. The cheaper the dollar, the easier it is to sell. Of course, "trade deals at gunpoint" might work in the short term, but economics is more than just the trade balance. Even now, we see the economy is growing, but almost all other indicators are declining.
Next week, the Eurozone will feature three Lagarde speeches and a few minor data releases. Don't expect anything major from Lagarde, as the European Central Bank just met last week and provided all the necessary info. Therefore, EU fundamentals and macro factors will have virtually no impact on the euro.
There's also an important medium-term factor: the policy divergence between the ECB and the Fed. The dollar has collapsed in 2025, even during months when the ECB was cutting rates and the Fed was holding them high. Now, the ECB is finished easing, while the Fed is just beginning.
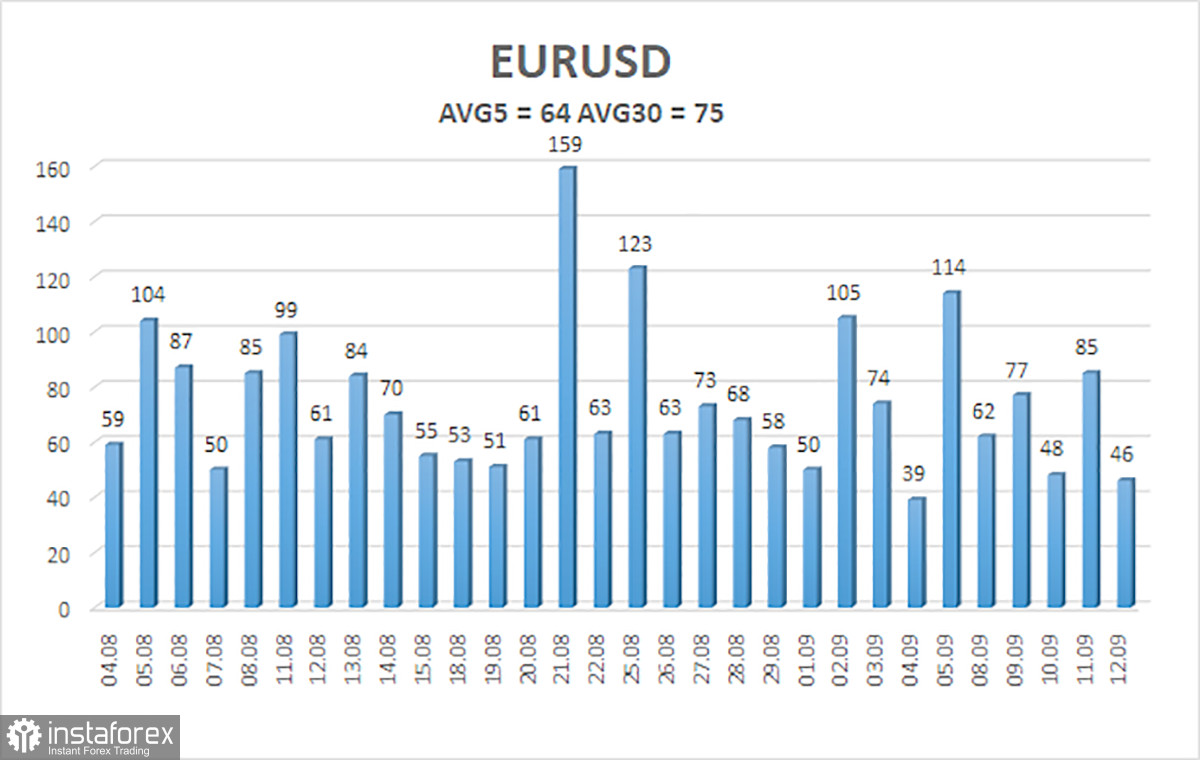
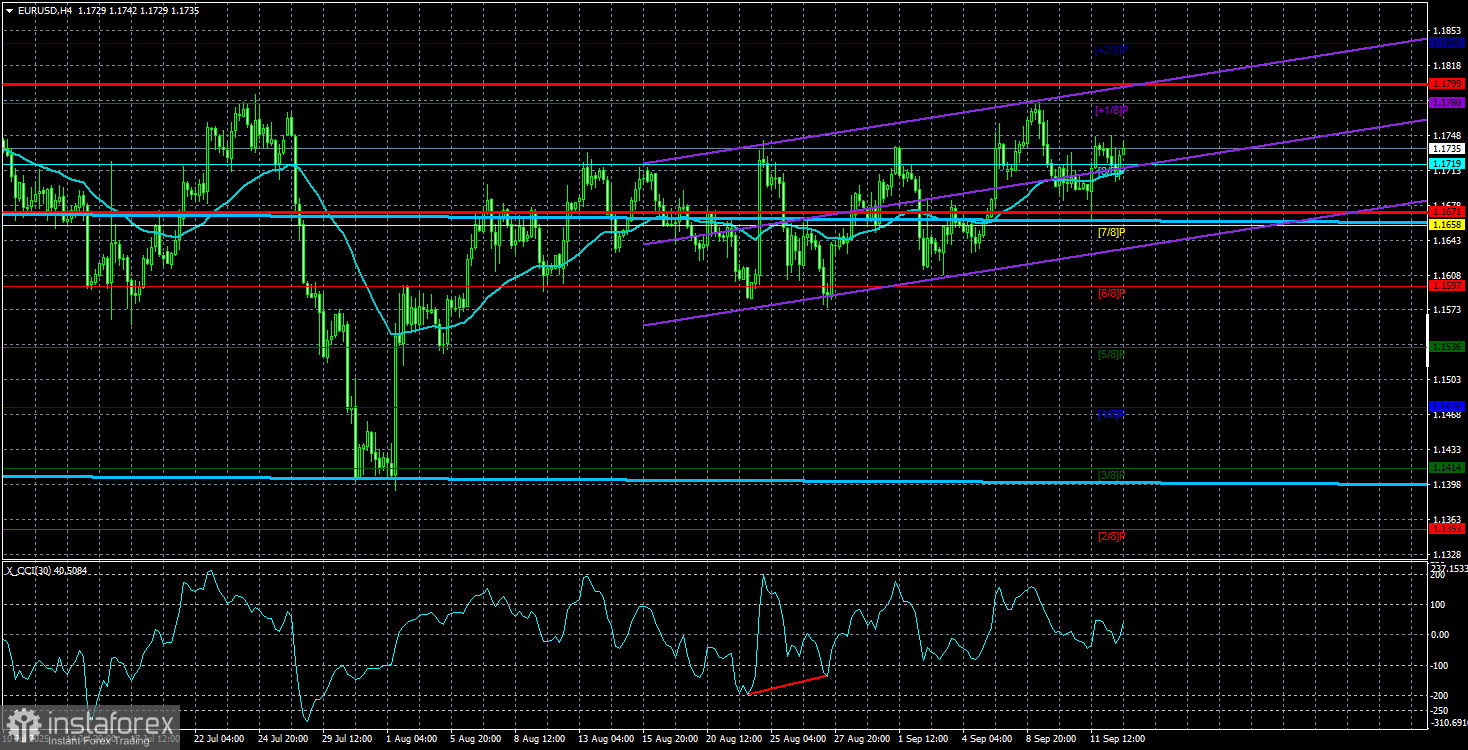
The average EUR/USD volatility over the last five sessions (as of September 14) is 64 pips, which is considered "average." We expect the pair to trade between 1.1671 and 1.1799 on Monday. The major linear regression channel is pointing up, signaling an ongoing uptrend. The CCI indicator has entered the oversold area three times, warning of resuming upward movement, and a bullish divergence has also formed, pointing to further growth.
Nearest Support Levels:
S1 – 1.1719
S2 – 1.1658
S3 – 1.1597
Nearest Resistance Levels:
R1 – 1.1780
R2 – 1.1841
Trading Recommendations:
EUR/USD can renew its uptrend. The US dollar is still under strong pressure from Trump's policies, and he has no intention of "stopping here." The dollar rallied as much as it could (not for long), but now it appears to be time for another prolonged decline. If the price is below the moving average, small shorts with a target of 1.1658 can be considered, strictly for correction purposes. Above the moving average, long positions remain relevant, with targets of 1.1780 and 1.1799 for trend continuation.
Chart Elements Explained:
- Linear regression channels help determine the current trend. If both channels point in the same direction, the trend is strong.
- The moving average line (settings 20,0, smoothed) indicates the short-term trend and trade direction.
- Murray levels serve as target levels for moves and corrections.
- Volatility levels (red lines) are the likely price channel for the next day, based on current volatility readings.
- The CCI indicator: dips below -250 (oversold) or rises above +250 (overbought) mean a trend reversal may be near.