 English
  Русский
 Bahasa Indonesia
 Bahasa Malay
 ไทย
ไทย Español
 Deutsch
 Български
 Français
 Tiếng Việt
 中文
中文 বাংলা
বাংলা हिन्दी
 Čeština
 Українська
 Română

A month ago, on August 19, we expected a US stock market reversal based on the completion of five DeMark sequences. However, that reversal didn't materialize—there was only a five-day correction. Now, however, we've encountered six sequences, marked by the number "9" on the daily chart.
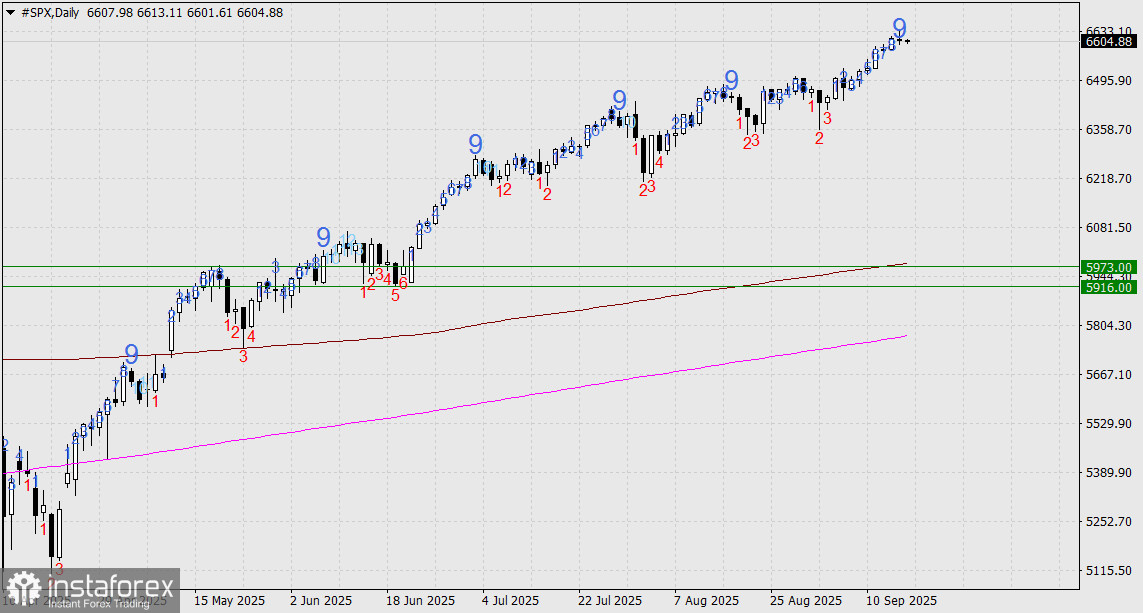
Given today's complex monetary policy decision, the Fed faces, the chances of a significant S&P 500 decline are even higher. Visually, the market could fall into the 5916–5973 range, a zone it traded in from mid-May to mid-June before resuming its uptrend. Another reference point is the simple moving average (SMA) with a period of 233, which currently lies just above that zone. The MA377 is below this range and will reach its lower boundary in about 40 trading days. Therefore, if the market breaks beneath the MA377 before then, a longer-term decline in the stock market may be in play.
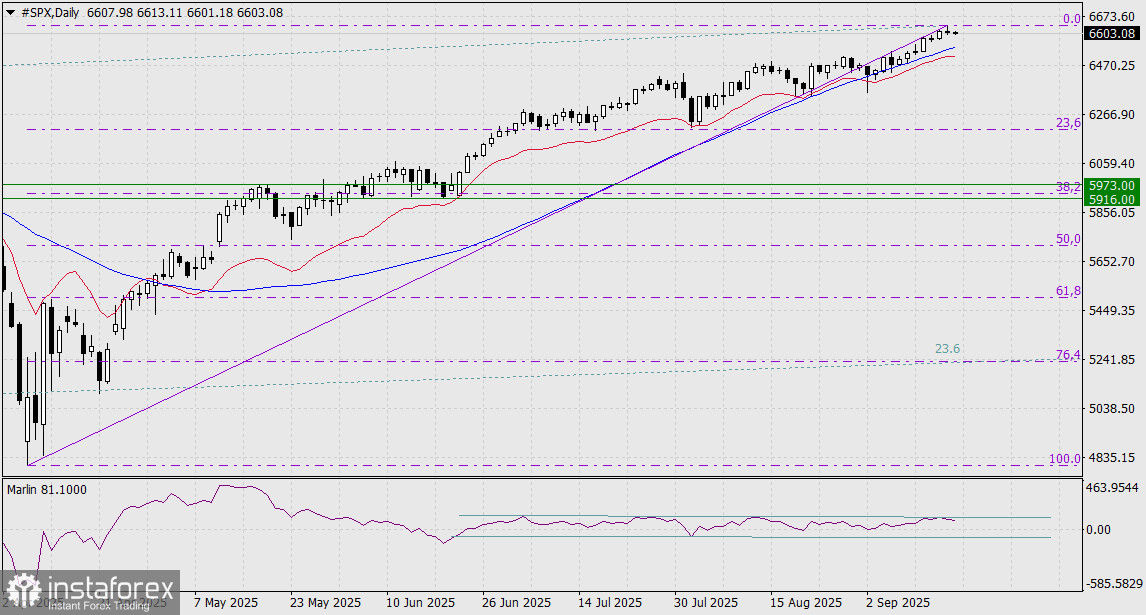
On the second daily chart, it's clear that since June—when the S&P 500 resumed growth out of the 5916–5973 range—the Marlin oscillator's signal line has been moving sideways, hovering around the zero line. Now, the signal line is turning down from the upper boundary of the channel. This indicates weakness in the entire three-month rally. Our target zone aligns with a 38.2% correction of the advance since April.