 English
  Русский
 Bahasa Indonesia
 Bahasa Malay
 ไทย
ไทย Español
 Deutsch
 Български
 Français
 Tiếng Việt
 中文
中文 বাংলা
বাংলা हिन्दी
 Čeština
 Українська
 Română

Thursday Trade Review:
1H Chart of GBP/USD
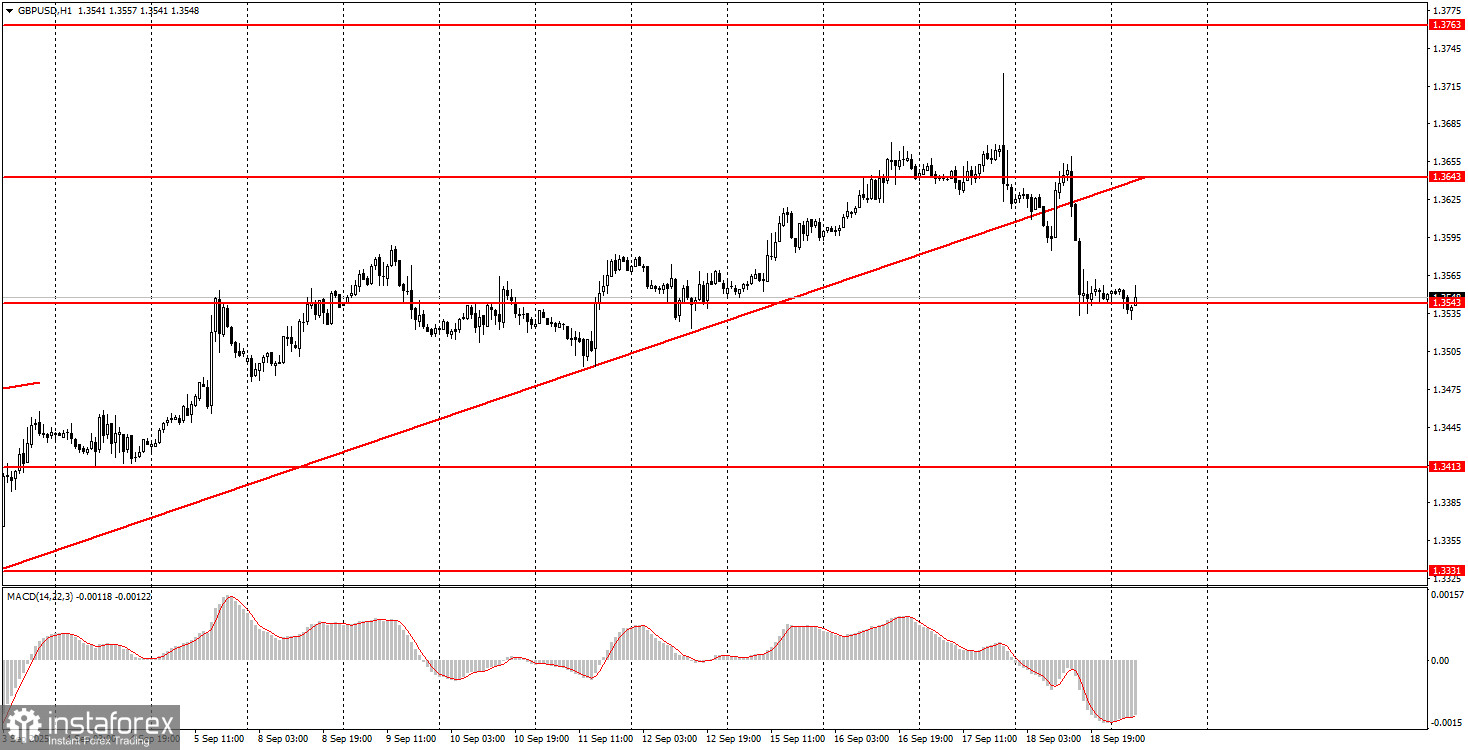
The GBP/USD pair exhibited movements on Thursday similar to those of EUR/USD—or rather, it would be more accurate to say that EUR/USD mirrored GBP/USD. The key event of the day was the Bank of England meeting. After the results were announced, the British pound continued to decline, despite the absence of strong reasons for it to fall, even on Wednesday evening. The BoE left its monetary policy unchanged and noted that core inflation is slowing and wage growth is decelerating—subtly opening the door for another policy easing this year. However, we don't really see any slowdown. Headline inflation in the UK has been rising for a whole year and is much closer to 4% than to 2%. Core inflation averages between 3.4% and 3.6%, with little change over the past year. Wage growth is slowing, but so far this hasn't significantly affected inflation. We believe that with current consumer price dynamics, the British central bank is unlikely to cut rates again.
5M Chart of GBP/USD
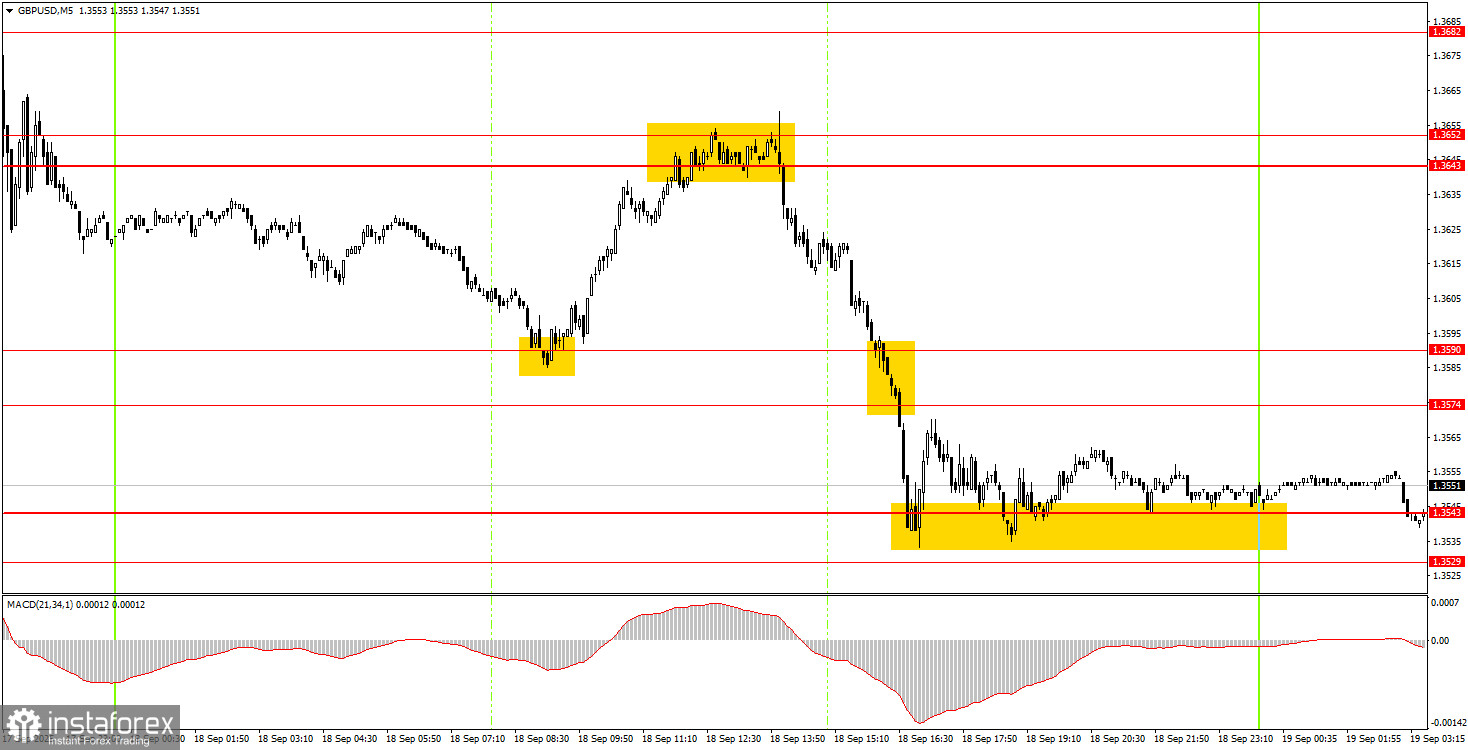
On the 5-minute timeframe on Thursday, quite a few trade signals were generated, and all of them were profitable. First, the pair rebounded from the 1.3590 level, then from the 1.3643–1.3652 area, before dropping to the 1.3529–1.3543 area. In all three cases, the targets were met. In total, novice traders could have opened two trades and earned about 100–110 pips from these opportunities.
How to Trade on Friday:
On the hourly timeframe, GBP/USD has settled below the trendline, so a new technical correction is possible after weeks of gains. As we've said earlier, we don't see any fundamental reason for the dollar to trend medium-term higher, so in the bigger picture, we still expect movement only to the upside. The daily chart is a clear guide to the current trend.
On Friday, GBP/USD could resume its move north if it bounces from the 1.3529–1.3543 area. A break below this area would allow for short positions with targets at 1.3466–1.3475.
For the 5-minute timeframe, you can now trade using the following levels: 1.3102–1.3107, 1.3203–1.3211, 1.3259, 1.3329–1.3331, 1.3413–1.3421, 1.3466–1.3475, 1.3529–1.3543, 1.3574–1.3590, 1.3643–1.3652, 1.3682, 1.3763. On Friday, a UK retail sales report will be released, which may only prompt a modest market reaction. No other significant events are scheduled for the last trading day of the week.
Core Trading System Rules:
- Signal Strength: The shorter the time it takes for a signal to form (a rebound or breakout), the stronger the signal.
- False Signals: If two or more trades near a level result in false signals, subsequent signals from that level should be ignored.
- Flat Markets: In flat conditions, pairs may generate many false signals or none at all. It's better to stop trading at the first signs of a flat market.
- Trading Hours: Open trades between the start of the European session and the middle of the US session, then manually close all trades.
- MACD Signals: On the hourly timeframe, trade MACD signals only during periods of good volatility and a clear trend confirmed by trendlines or trend channels.
- Close Levels: If two levels are too close (5–20 pips apart), treat them as a support or resistance zone.
- Stop Loss: Set a Stop Loss to breakeven after the price moves 20 pips in the desired direction.
Key Chart Elements:
Support and Resistance Levels: These are target levels for opening or closing positions and can also serve as points for placing Take Profit orders.
Red Lines: Channels or trendlines indicating the current trend and the preferred direction for trading.
MACD Indicator (14,22,3): A histogram and signal line used as a supplementary source of trading signals.
Important Events and Reports: Found in the economic calendar, these can heavily influence price movements. Exercise caution or exit the market during their release to avoid sharp reversals.
Forex trading beginners should remember that not every trade will be profitable. Developing a clear strategy and practicing proper money management are essential for long-term trading success.