 English
  Русский
 Bahasa Indonesia
 Bahasa Malay
 ไทย
ไทย Español
 Deutsch
 Български
 Français
 Tiếng Việt
 中文
中文 বাংলা
বাংলা हिन्दी
 Čeština
 Українська
 Română

Trend analysis (Fig. 1).
On Friday, the market from the level of 1.3551 (yesterday's daily candle close) may continue moving downward toward the target of 1.3482 – the 61.8% retracement level (red dashed line). When testing this level, a corrective upward movement is possible with a target of 1.3501 – the 38.2% retracement level (yellow dashed line).
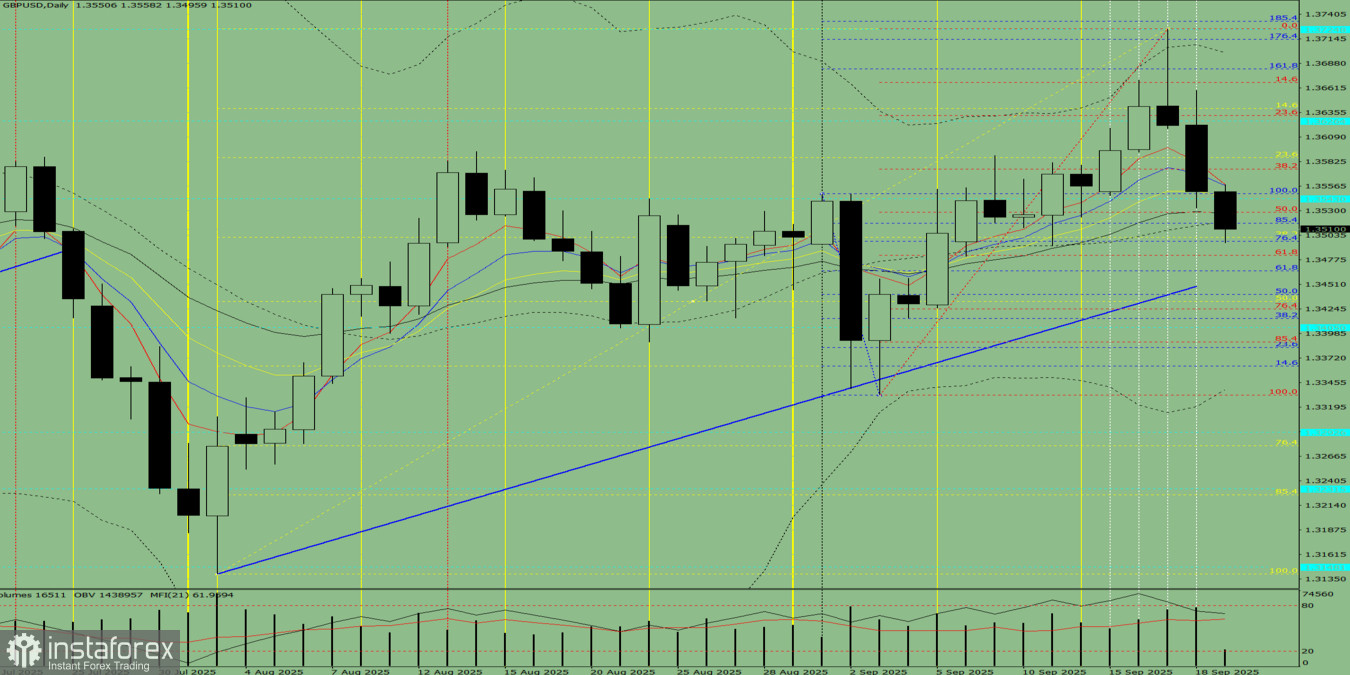
Fig. 1 (daily chart).
Comprehensive analysis:
- Indicator analysis – down;
- Fibonacci levels – down;
- Volumes – down;
- Candlestick analysis – down;
- Trend analysis – down;
- Bollinger Bands – down;
- Weekly chart – up.
General conclusion: downward trend.
Alternative scenario: From the level of 1.3551 (yesterday's daily candle close), the price may continue moving downward toward the target of 1.3465 – the 61.8% retracement level (blue dashed line). When testing this level, a corrective upward movement is possible with a target of 1.3482 – the 61.8% retracement level (red dashed line).