 English
  Русский
 Bahasa Indonesia
 Bahasa Malay
 ไทย
ไทย Español
 Deutsch
 Български
 Français
 Tiếng Việt
 中文
中文 বাংলা
বাংলা हिन्दी
 Čeština
 Українська
 Română

Trend Analysis (Fig. 1)
This week, from the 1.1745 level (the close of the last weekly candle), the market may begin moving down with a target of 1.1536 – the 38.2% retracement level (blue dashed line). Upon testing this level, the price may bounce upward toward the target of 1.1572 – the upper fractal (red dashed line).
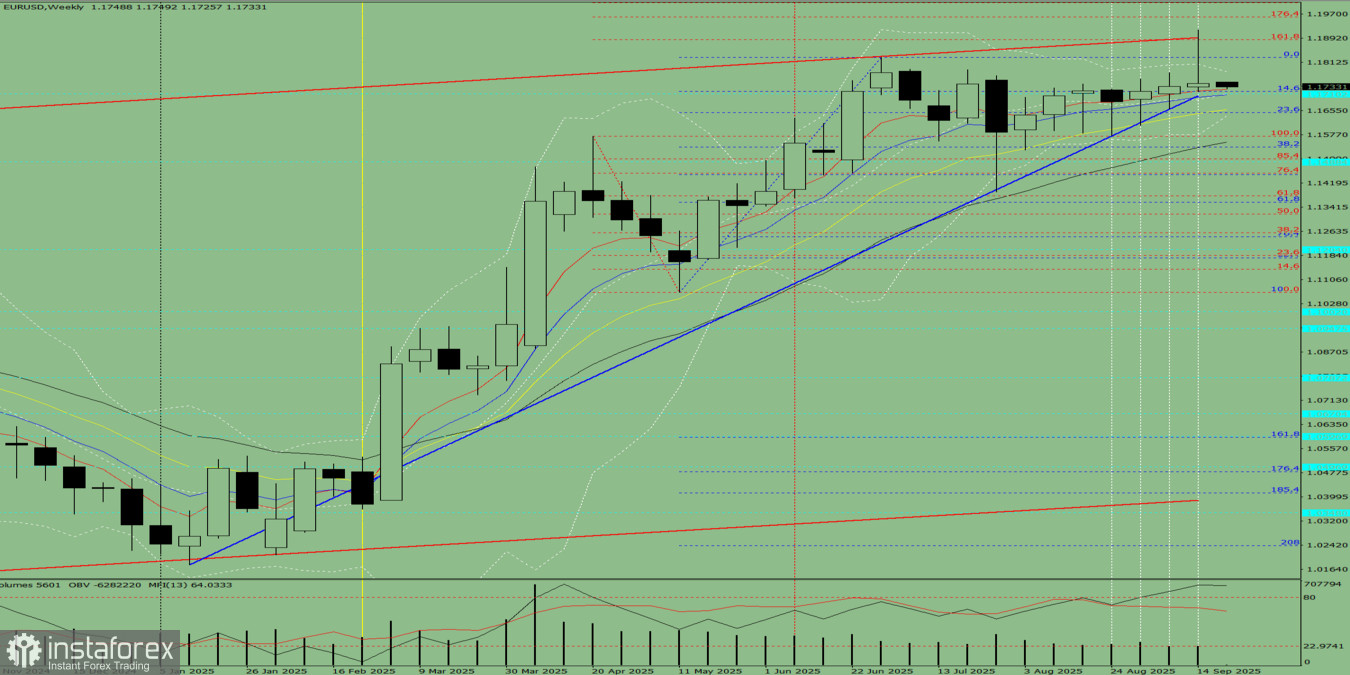
Fig. 1 (weekly chart)
Comprehensive Analysis:
- Indicator analysis – downward;
- Fibonacci levels – downward;
- Volume – downward;
- Candlestick analysis – downward;
- Trend analysis – downward;
- Bollinger Bands – downward;
- Monthly chart – downward.
Conclusion from comprehensive analysis: downward movement.
Overall candle projection for the EUR/USD pair on the weekly chart: the price is most likely to show a downward trend during the week, featuring an initial upper shadow on the weekly black (bearish) candle (Monday – upward move), and a secondary lower shadow (Friday – upward move).
Alternative Scenario: The pair may start moving downward from the 1.1745 level (close of the last weekly candle) with a target of 1.1572 – the upper fractal (red dashed line). Upon testing this level, the price may begin moving upward toward the 23.6% retracement level at 1.1647 (blue dashed line).