 English
  Русский
 Bahasa Indonesia
 Bahasa Malay
 ไทย
ไทย Español
 Deutsch
 Български
 Français
 Tiếng Việt
 中文
中文 বাংলা
বাংলা हिन्दी
 Čeština
 Українська
 Română

GBP/USD 5-Minute Analysis
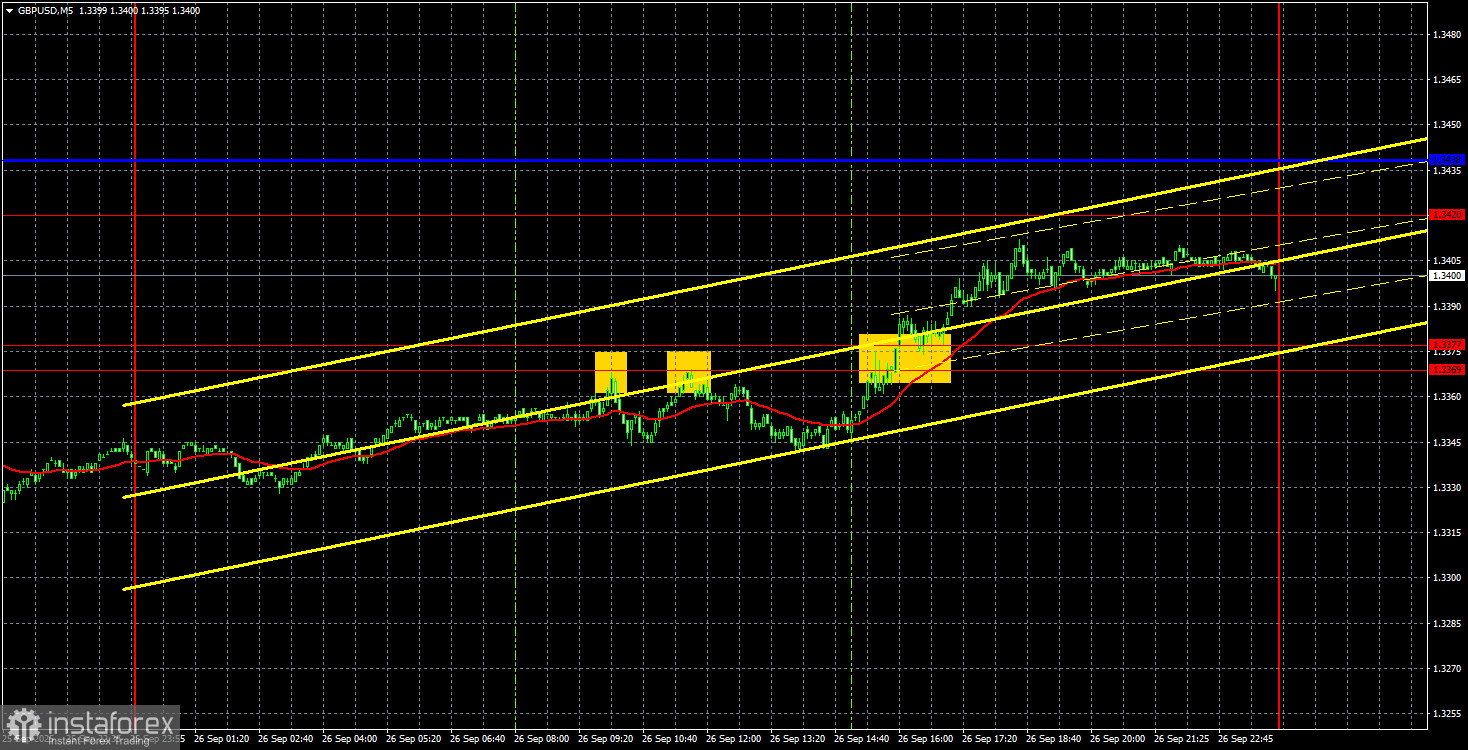
On Friday, the GBP/USD pair recovered significantly, so it is too early to write off the British currency. Over the past week and a half, the pound has gone through a rough patch, but we still believe this weakness will be short-lived. Even when all factors point in one direction, technical corrections are inevitable. Individual reports and events can trigger counter-trend movements, which, on lower timeframes, may appear as independent trends. This is precisely the kind of trend we are observing now on the hourly chart.
On Friday, the pound was strongly supported by the University of Michigan Consumer Sentiment Index. The indicator once again came in below forecasts, triggering a decline in the dollar in the second half of the day. Overall, the pair is currently trading around the trendline and may attempt to break above it on Monday, as the global fundamental background continues to favor the pound. The Kijun-sen line is also nearby, and a breakout above it would allow for expectations of further upward movement toward the Senkou Span B line.
On the 5-minute timeframe, three trading signals were formed on Friday, with daily volatility totaling 85 pips. This is neither too high nor too low. The first two sell signals, in the form of rebounds from the 1.3369–1.3377 range, were weak, as the price failed to move even 20 pips in the right direction. Later, the pair broke through this range, after which the pound gained 20 pips. Thus, the first two signals duplicated each other but turned out to be false, while the third allowed a maximum of 20 pips in profit.
COT Report
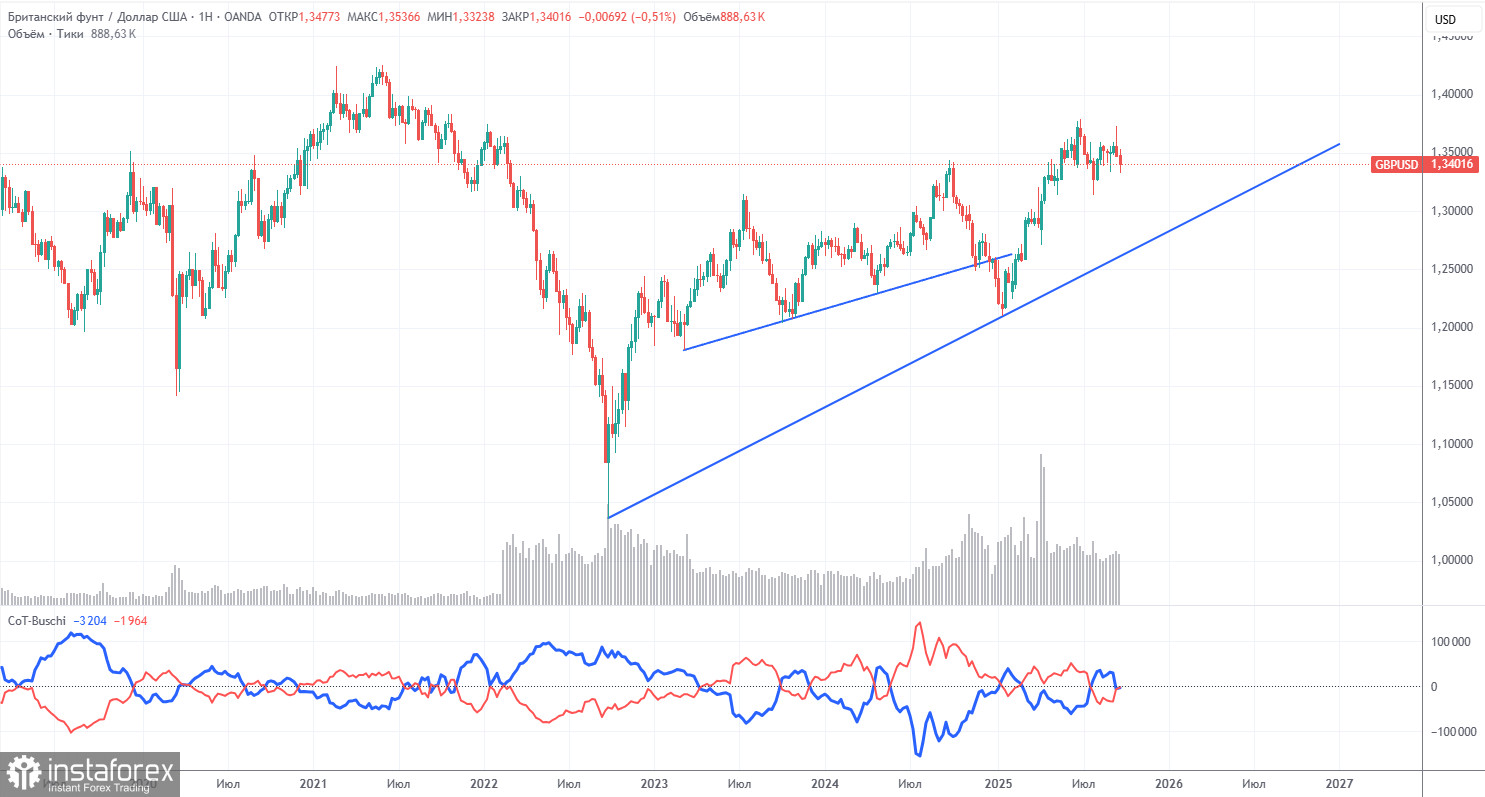
COT reports on the British pound indicate that, in recent years, the sentiment of commercial traders has shifted constantly. The red and blue lines, reflecting net positions of commercial and non-commercial traders, frequently intersect and mostly remain close to zero. Currently, they are nearly at the same level, indicating an approximately equal number of long and short positions.
The dollar continues to decline due to Donald Trump's policies, so the demand from market makers for the pound is not particularly important at this stage. The trade war is likely to persist in one form or another for an extended period. The Fed will likely continue cutting rates over the next year, which will reduce demand for the dollar. According to the latest report on the British pound, the "Non-commercial" group opened 3,700 long contracts and closed 900 short contracts. As a result, the net position of non-commercial traders rose by 4,600 contracts over the week.
In 2025, the pound experienced a strong appreciation, but this was primarily due to the policies of Donald Trump. Once this factor is neutralized, the dollar may enter a growth phase, but no one knows when that will happen. Regardless of the pace of net positioning changes for the pound, net positioning on the dollar is still declining—usually at a faster rate.
GBP/USD 1-Hour Analysis
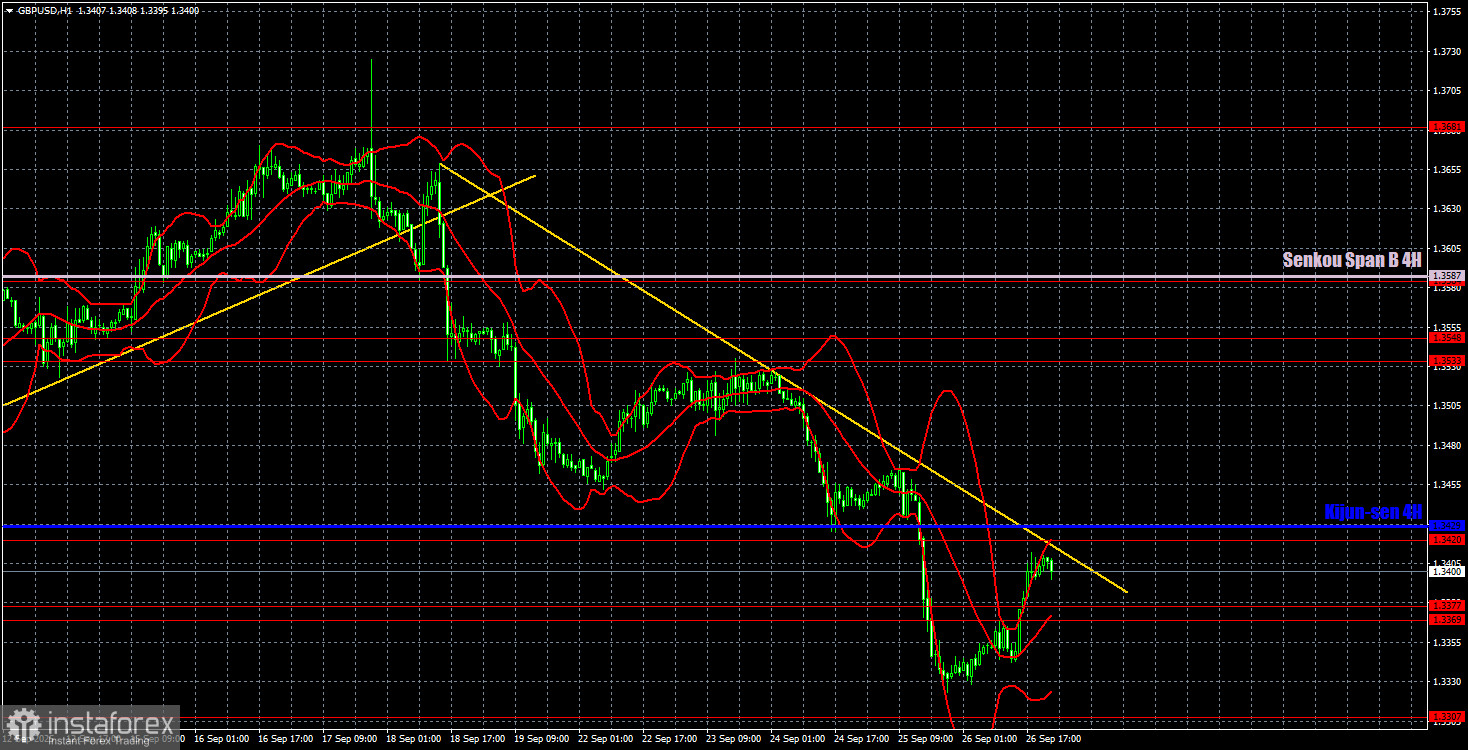
On the hourly timeframe, the GBP/USD pair began to decline the week before last due to negative fundamentals, and the fall continued last week for the same reason. The dollar still lacks global reasons to strengthen, so we expect the 2025 uptrend to resume in almost all cases. However, on the hourly chart, a breakout above the trendline is required before counting on a new upward trend.
For September 29, we highlight the following important levels: 1.3125, 1.3212, 1.3369–1.3377, 1.3420, 1.3533–1.3548, 1.3584, 1.3681, 1.3763, 1.3833, 1.3886. The Senkou Span B (1.3587) and Kijun-sen (1.3429) lines may also generate signals. Stop-loss orders are recommended to be moved to breakeven once the price moves 20 pips in the desired direction. The Ichimoku indicator lines can shift during the day, which should be considered when determining trading signals.
On Monday, no major macroeconomic or fundamental events are scheduled in the U.K. or the U.S. Therefore, volatility during the day is expected to remain low. The pound may attempt to continue its recovery.
Trading Recommendations
Today, traders may expect further decline if the price remains below the trendline and corresponding sell signals are formed. These could be rebounds from the Kijun-sen line, the 1.3420 level, or a breakout below the 1.3369–1.3377 range.
Illustration Explanations:
- Support and resistance price levels – thick red lines where movement may end. They are not trading signal sources.
- Kijun-sen and Senkou Span B lines—These are strong Ichimoku indicator lines transferred to the hourly timeframe from the 4-hour one.
- Extremum levels – thin red lines where the price has previously rebounded. These act as trading signal sources.
- Yellow lines – trend lines, trend channels, and other technical patterns.
- Indicator 1 on the COT charts – the size of the net position for each category of traders.