 English
  Русский
 Bahasa Indonesia
 Bahasa Malay
 ไทย
ไทย Español
 Deutsch
 Български
 Français
 Tiếng Việt
 中文
中文 বাংলা
বাংলা हिन्दी
 Čeština
 Українська
 Română

During the upcoming week, the EUR/USD pair is expected to attempt to resume its upward trend. This conclusion is based on the current market situation, expectations of major banks, and the forthcoming fundamental and macroeconomic context. Let's break it down. The decline of the European currency over the past two weeks does not cancel the upward trend on either the 4-hour or daily timeframes. On the daily chart, the picture is clear: the dollar is only capable of occasional small corrections. Indeed, over the past week and a half, fundamentals and macro data have supported the U.S. currency, but how many such episodes can you recall in 2025? They are as rare as snow in May.
Despite the dollar strengthening toward 1.17, virtually no major bank is betting on further dollar appreciation. There are simply no grounds for such expectations, a point we have repeated for months. Of course, market makers can still buy the U.S. currency, potentially causing further strengthening. However, since we cannot know their plans, our analysis is based strictly on fundamentals and macroeconomics.
The euro's fundamental backdrop remains unchanged. There is no chance that the European Central Bank will cut rates again in the near term. The Federal Reserve, on the other hand—despite Jerome Powell's contradictory rhetoric—appears ready for two more rate cuts in 2025. In addition, Donald Trump recently resurfaced with fresh tariffs last week. There are no signs of an end to the global trade war, which has been one of the main drivers behind the dollar's decline in 2025.
This week, there will be several euro-specific developments worth watching. First, a series of ECB speakers will likely emphasize the lack of need for rate cuts and highlight the risks of accelerating inflation. Second, inflation reports for September will be published, potentially confirming the worst fears. CPI in Germany is expected to rise to 2.3%, with a similar outcome for the eurozone as a whole. These reports could provide fresh support to the euro.
It is worth noting that the ECB has not ruled out the possibility of raising rates if the circumstances require it. If inflation continues rising for several months, we cannot exclude a tightening scenario. Such a move would undoubtedly strengthen the euro further.
In this article, we deliberately set aside the U.S. macro background, though it will remain the key market driver. The first week of the new month traditionally includes ISM indices, labor market data, and unemployment figures. These reports will largely determine whether the Fed continues easing. If the labor market starts to recover (which seems unlikely), the odds of two additional rate cuts this year will decline sharply, potentially providing the dollar with temporary support. Still, we view this scenario as having a low probability.
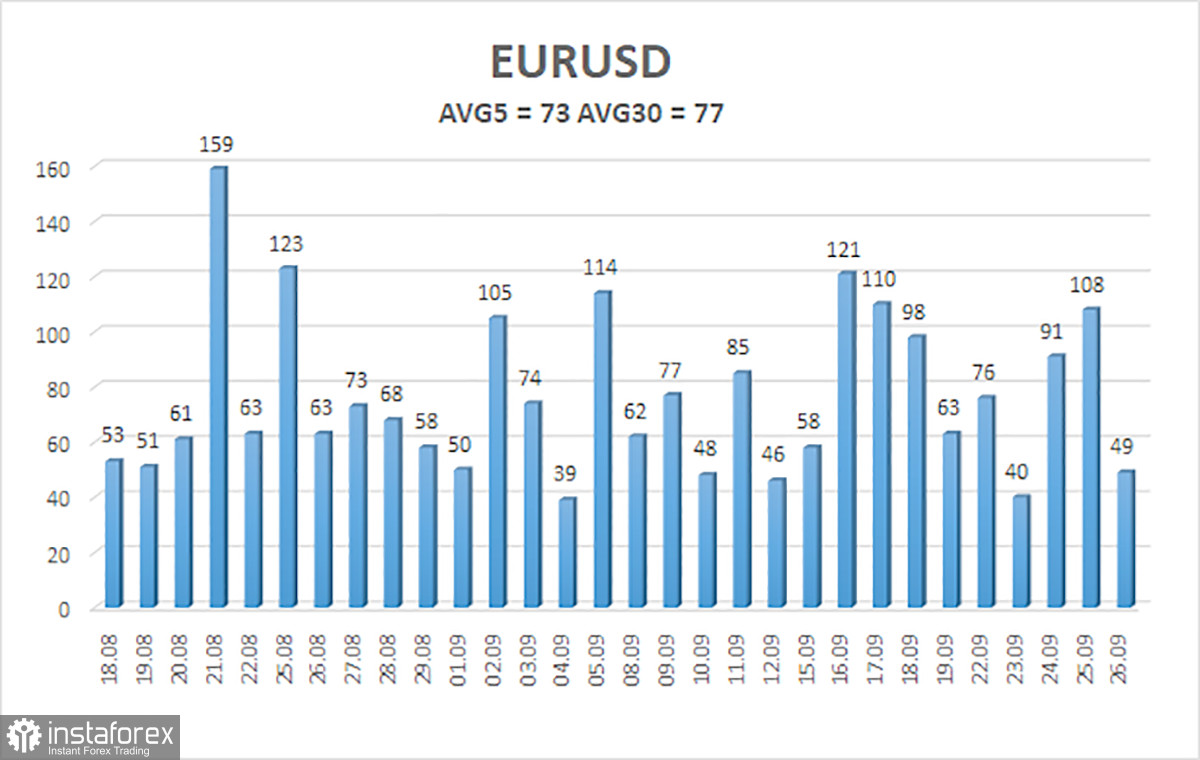
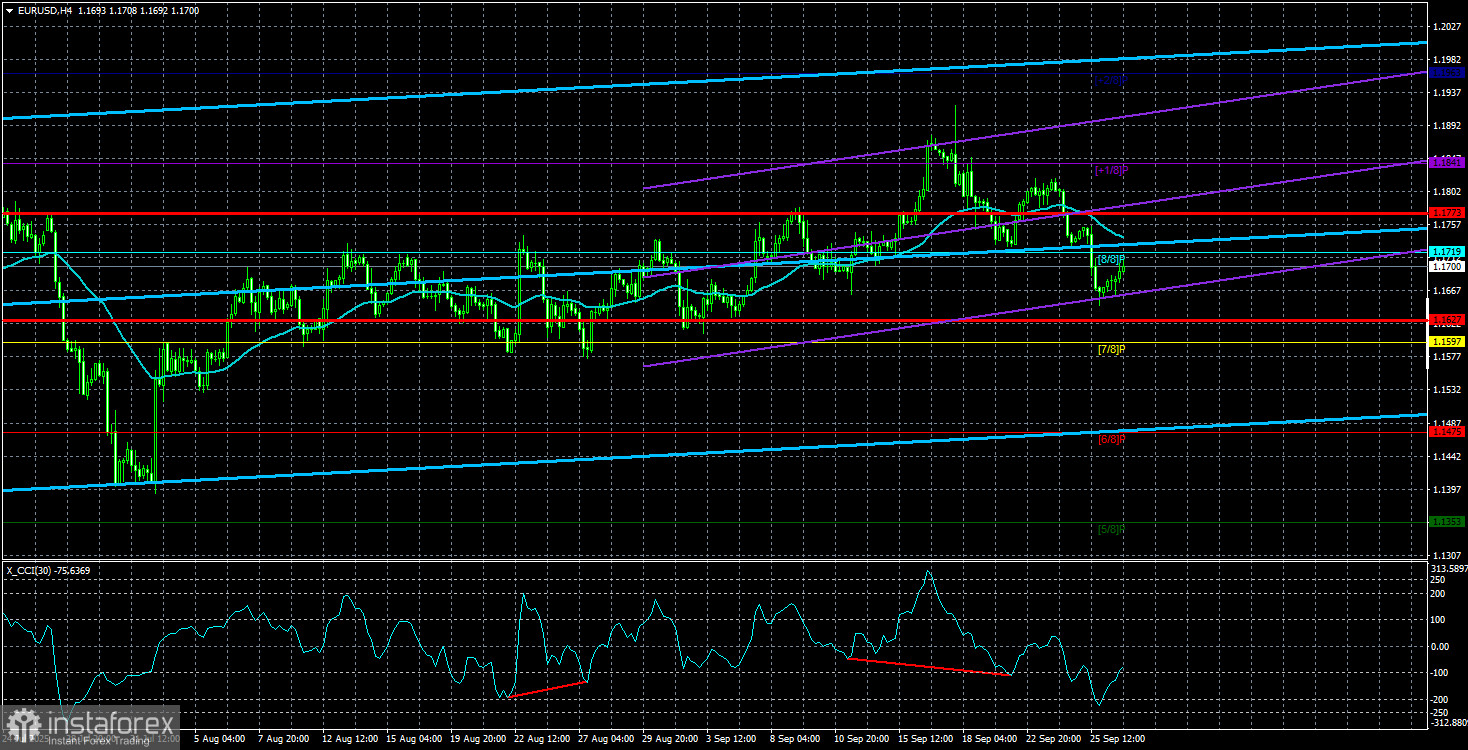
The average volatility of EUR/USD over the last five trading days, as of September 27, is 73 pips, classified as "average." We expect the pair to move between 1.1627 and 1.1773 on Monday. The longer-term linear regression channel points upward, confirming the broader bullish trend. The CCI entered overbought territory last week, triggering a fresh downward correction.
Nearest Support Levels:
S1 – 1.1597
S2 – 1.1475
S3 – 1.1353
Nearest Resistance Levels:
R1 – 1.1719
R2 – 1.1841
R3 – 1.1963
Trading Recommendations:
The EUR/USD pair has entered a new corrective phase, but the overall upward trend remains intact across all timeframes. The U.S. dollar continues to face strong headwinds from Donald Trump's policies, which are far from over. The dollar has rallied as much as it could (for an entire month), but it now seems poised for another prolonged decline.
If the price is below the moving average, short positions may be considered on a purely technical basis, targeting 1.1627 and 1.1597. If the price trades above the moving average, long positions remain relevant with targets at 1.1841 and 1.1963, in line with the prevailing trend.
Chart Elements Explained:
- Linear regression channels help determine the current trend. If both channels point in the same direction, the trend is strong.
- The moving average line (settings 20,0, smoothed) indicates the short-term trend and trade direction.
- Murray levels serve as target levels for moves and corrections.
- Volatility levels (red lines) are the likely price channel for the next day, based on current volatility readings.
- The CCI indicator: dips below -250 (oversold) or rises above +250 (overbought) mean a trend reversal may be near.