 English
  Русский
 Bahasa Indonesia
 Bahasa Malay
 ไทย
ไทย Español
 Deutsch
 Български
 Français
 Tiếng Việt
 中文
中文 বাংলা
বাংলা हिन्दी
 Čeština
 Українська
 Română

Trend analysis (Fig. 1).
This week, the market from the level of 1.1699 (close of the last weekly candle) may start moving downward with the target at 1.1536 – the 38.2% pullback level (blue dotted line). When testing this level, the price may retrace upward with the target at 1.1572 – the upper fractal (red dotted line).
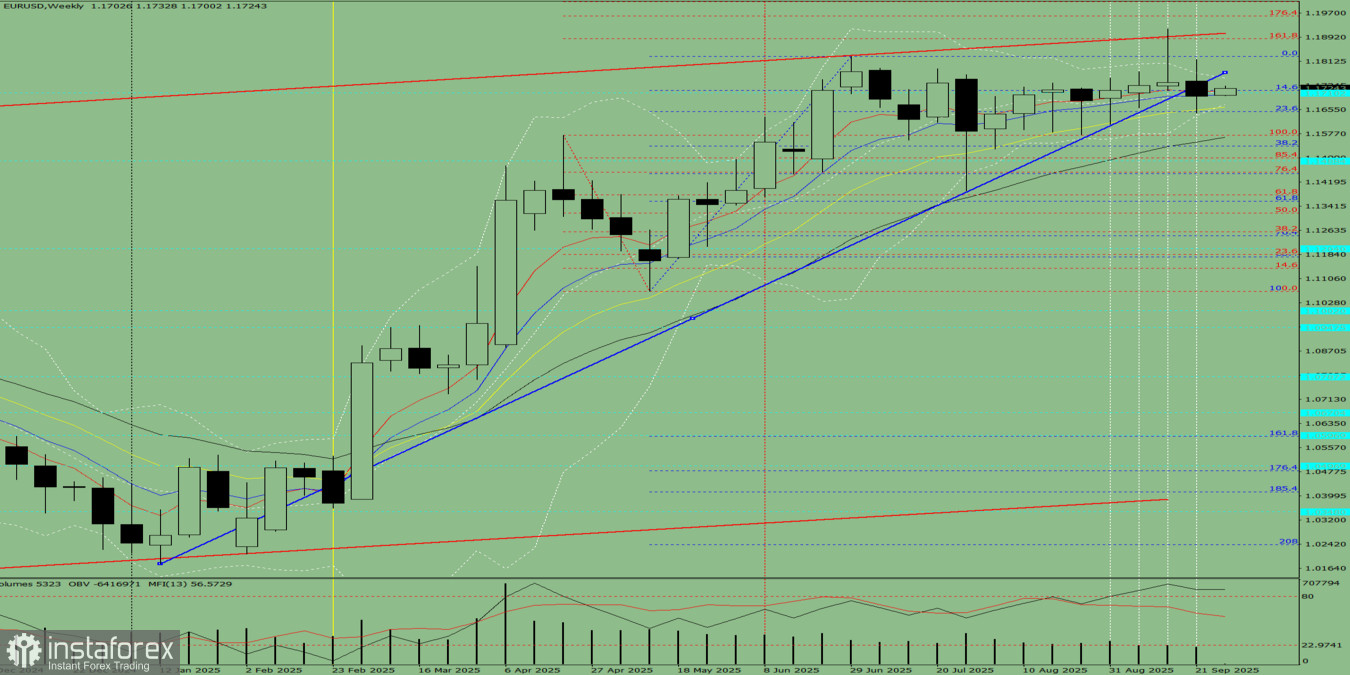
Fig. 1 (weekly chart).
Comprehensive analysis:
- Indicator analysis – down;
- Fibonacci levels – down;
- Volumes – down;
- Candlestick analysis – down;
- Trend analysis – down;
- Bollinger Bands – down;
- Monthly chart – down.
Conclusion of the comprehensive analysis: downward movement.
Overall outcome of the weekly candle calculation for EUR/USD: during the week, the price will most likely show a downward trend, with the first upper shadow on the weekly black candle (Monday – upward) and the second lower shadow (Friday – upward).
Alternative scenario: the pair from the level of 1.1699 (close of the last weekly candle) may start moving downward with the target at 1.1488 – the historical resistance level (light blue dotted line). When testing this level, the price may then start moving upward with the target at 1.1536 – the 38.2% pullback level (blue dotted line).