 English
  Русский
 Bahasa Indonesia
 Bahasa Malay
 ไทย
ไทย Español
 Deutsch
 Български
 Français
 Tiếng Việt
 中文
中文 বাংলা
বাংলা हिन्दी
 Čeština
 Українська
 Română

Trend Analysis
In October, from the level of 1.1732 (closing of the September monthly candle), the price may continue moving upward with the target at 1.1918 – the upper fractal (yellow dashed line). From this level, a corrective move downward is possible with the target at 1.1664 – the 14.6% retracement level (yellow dashed line).
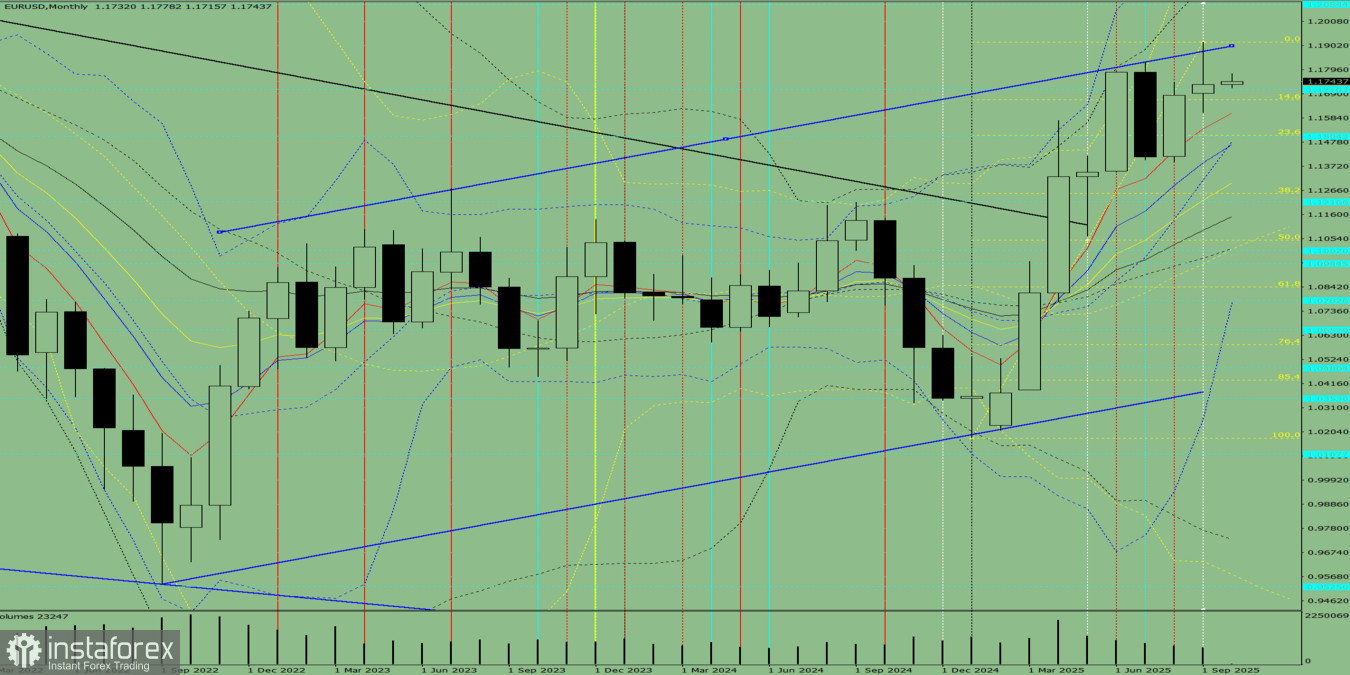
Fig. 1 (monthly chart).
Indicator Analysis:
- Indicator analysis – upward;
- Fibonacci levels – upward;
- Volumes – upward;
- Candlestick analysis – upward;
- Trend analysis – upward;
- Bollinger Bands – upward.
Comprehensive analysis conclusion: an upward trend is possible.
Overall outcome for the EUR/USD monthly candle calculation: the price will most likely have an upward trend, with the absence of the first lower shadow of the monthly white candle (first week of the month – white) and the presence of the second upper shadow (last week of the month – black).
Alternative scenario: from the level of 1.1732 (closing of the September monthly candle), the price may continue moving upward with the target at 1.2084 – the upper fractal (blue dashed line). From this level, a downward move is possible with the target at 1.1710 – the historical resistance level (blue dashed line).