 English
  Русский
 Bahasa Indonesia
 Bahasa Malay
 ไทย
ไทย Español
 Deutsch
 Български
 Français
 Tiếng Việt
 中文
中文 বাংলা
বাংলা हिन्दी
 Čeština
 Українська
 Română

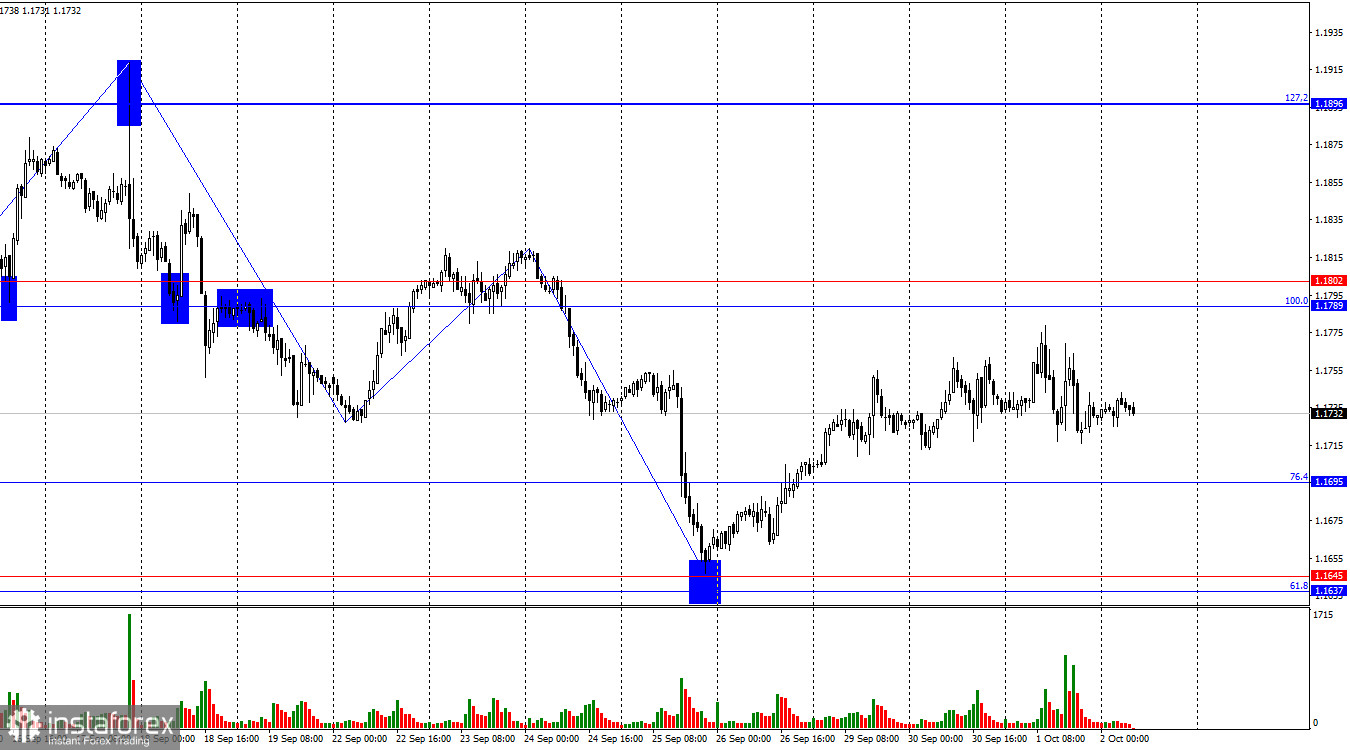
On Wednesday, the EUR/USD pair tried to continue its upward movement toward the resistance zone of 1.1789–1.1802, but the news background dampened bullish sentiment. No trading signals were generated yesterday. Today, a rebound from the 76.4% retracement level at 1.1695 would favor the euro and a resumption of growth toward the 1.1789–1.1802 zone, while a close below this level would open the way to a decline toward the support zone of 1.1637–1.1645.
The wave pattern on the hourly chart remains simple and clear. The last completed downward wave broke the previous wave's low, while the new upward wave has not yet broken the last peak. Thus, the trend is still "bearish" for now. The latest labor market data and changing Fed monetary policy outlook support bullish traders, so the trend may start to shift this week. For the "bearish" trend to end, price consolidation above the last peak at 1.1819 is required.
Wednesday brought many notable global events. First, the U.S. government shutdown began. In my view, this event alone is sufficient reason for bullish traders to keep pressing their advantage. The U.S. economy faces a new challenge, with most experts expecting contraction. Second, the euro area inflation report somewhat disappointed bulls, as inflation rose only weakly. Although rising inflation is generally not positive for the economy, under current circumstances, the higher it is, the more "hawkish" the ECB will remain until year-end. Since inflation remains sluggish at around 2%, traders allow for the possibility that the European regulator may cut rates once more before year-end. Thus, yesterday both the dollar and the euro had grounds for weakness. As seen on the hourly chart, both currencies spent the entire day engaged in this tug-of-war.
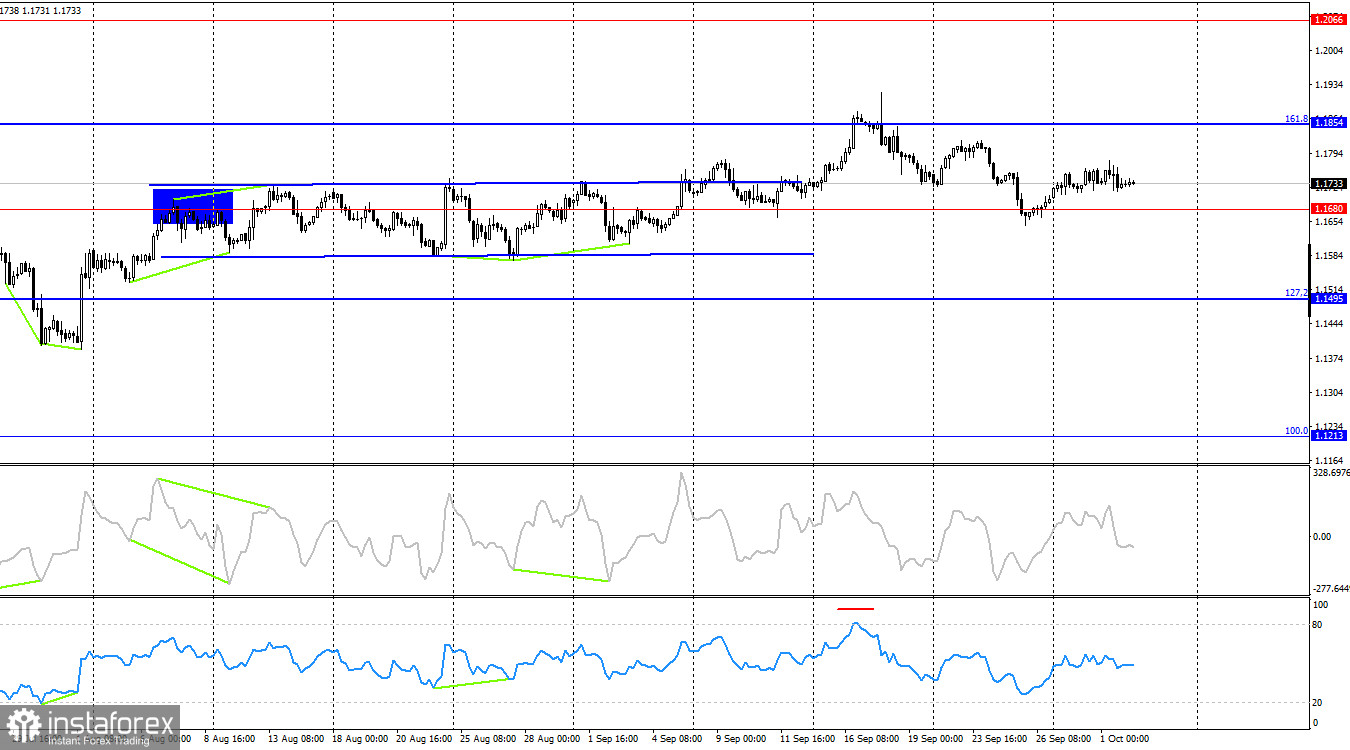
On the 4-hour chart, the pair turned upward near the 1.1680 level, favoring the euro. Therefore, the upward movement may resume toward the 161.8% retracement level at 1.1854. A close below 1.1680 would work in favor of the U.S. dollar and open the way to further decline toward the 127.2% Fibonacci level at 1.1495. No emerging divergences are observed today.
Commitments of Traders (COT) Report:
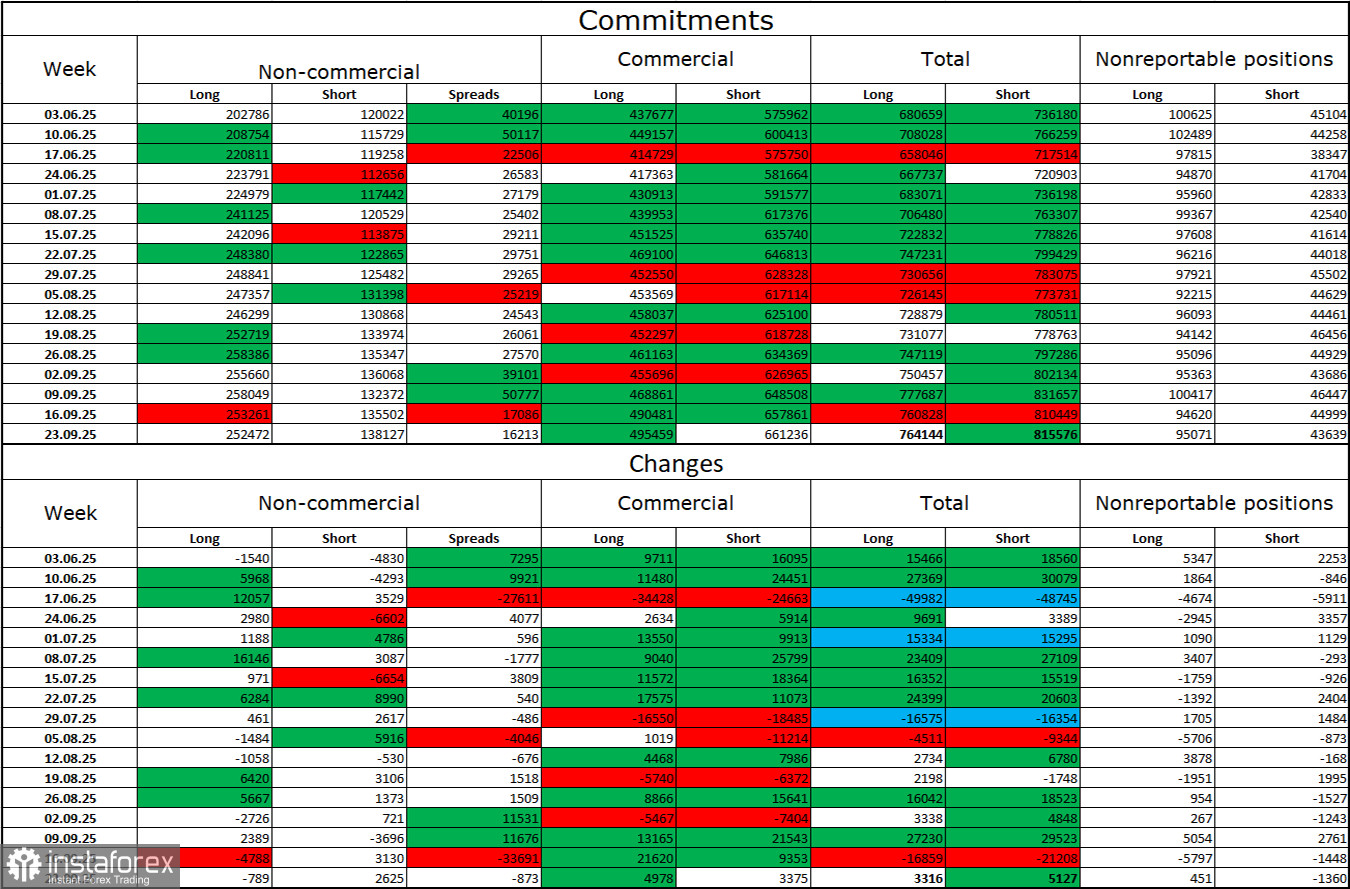
During the last reporting week, professional players closed 789 long positions and opened 2,625 short positions. The sentiment of the "Non-commercial" group remains "bullish" thanks to Donald Trump and continues to strengthen over time. The total number of long positions held by speculators is now 252,000 versus 138,000 short positions—almost a two-to-one ratio. Also note the number of green cells in the table above, reflecting strong position-building in the euro. In most cases, interest in the euro continues to grow, while interest in the dollar is fading.
For thirty-three consecutive weeks, large players have been reducing short positions and building longs. Donald Trump's policies remain the most important factor for traders, as they may create long-term, structural problems for America. Despite the signing of several major trade agreements, many key economic indicators continue to decline.
News calendar for the U.S. and the euro area:
- Eurozone – Unemployment rate (09:00 UTC)
- U.S. – Initial Jobless Claims (12:30 UTC)
On October 2, the economic calendar contains two entries, neither of which can be considered important. The impact of the news background on market sentiment on Thursday will be very weak or absent altogether.
Forecast for EUR/USD and trader tips:
Selling the pair was possible on a close below the 1.1789–1.1802 support level on the hourly chart, with targets at 1.1695 and 1.1637–1.1645. All targets have been reached. New sales will be possible on a rebound from the 1.1789–1.1802 level, targeting 1.1695. Buying was possible on a rebound from the 1.1637–1.1645 level with targets at 1.1695 and 1.1789–1.1802. These positions can remain open today, with stop-losses moved to break-even levels.
The Fibonacci grids are built from 1.1789–1.1392 on the hourly chart and from 1.1214–1.0179 on the 4-hour chart.