 English
  Русский
 Bahasa Indonesia
 Bahasa Malay
 ไทย
ไทย Español
 Deutsch
 Български
 Français
 Tiếng Việt
 中文
中文 বাংলা
বাংলা हिन्दी
 Čeština
 Українська
 Română

EUR/USD Analysis, 5M
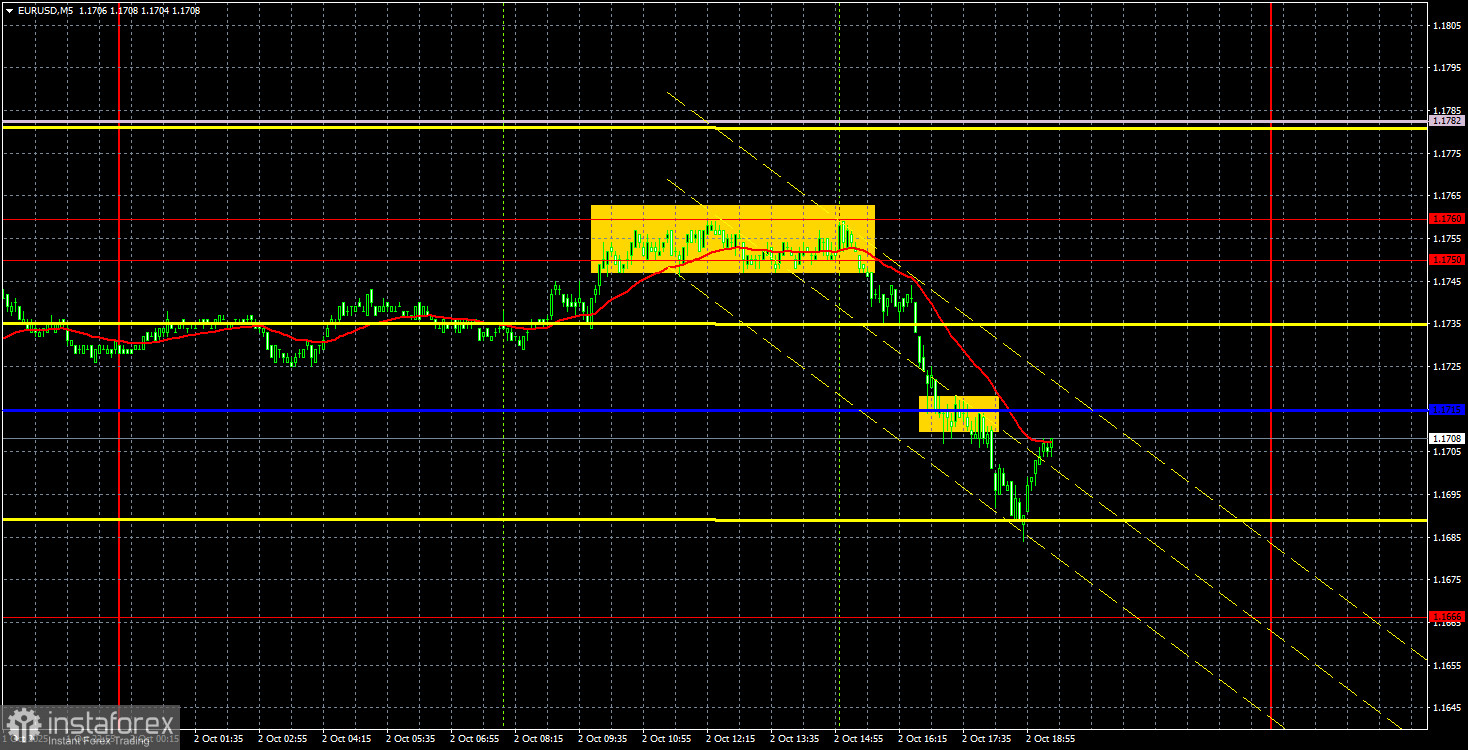
On Thursday, the EUR/USD currency pair unexpectedly declined. Over the past couple of weeks, the dollar has accumulated several new factors that weaken its position against its competitors. Yet instead of a natural rise in the pair, we see either flat movement or even declines. From our perspective, the dollar should already be plunging into another downturn, so these "twitches" can hardly be called movement—nor are they particularly logical.
The formal reason for the euro's decline on Thursday was the unemployment report in the euro area, which showed that the rate unexpectedly rose to 6.3%. This could have triggered pressure on the euro. However, the drop started about two hours after the report, so it is uncertain whether that was the real driver. Still, there were no other factors behind the euro's fall. Overall, this week began with a U.S. government shutdown, while the ADP report showed further job losses in the private sector.
On the 5-minute timeframe, two sell signals were generated. Throughout the European session, the price attempted to bounce off the 1.1750–1.1760 area and eventually succeeded. Later, the Kijun-sen line was broken, but the pair failed to reach the nearest target. Traders could have opened shorts but had to close them around the critical line or set Stop Loss to breakeven and hold the trade until the end.
COT Report
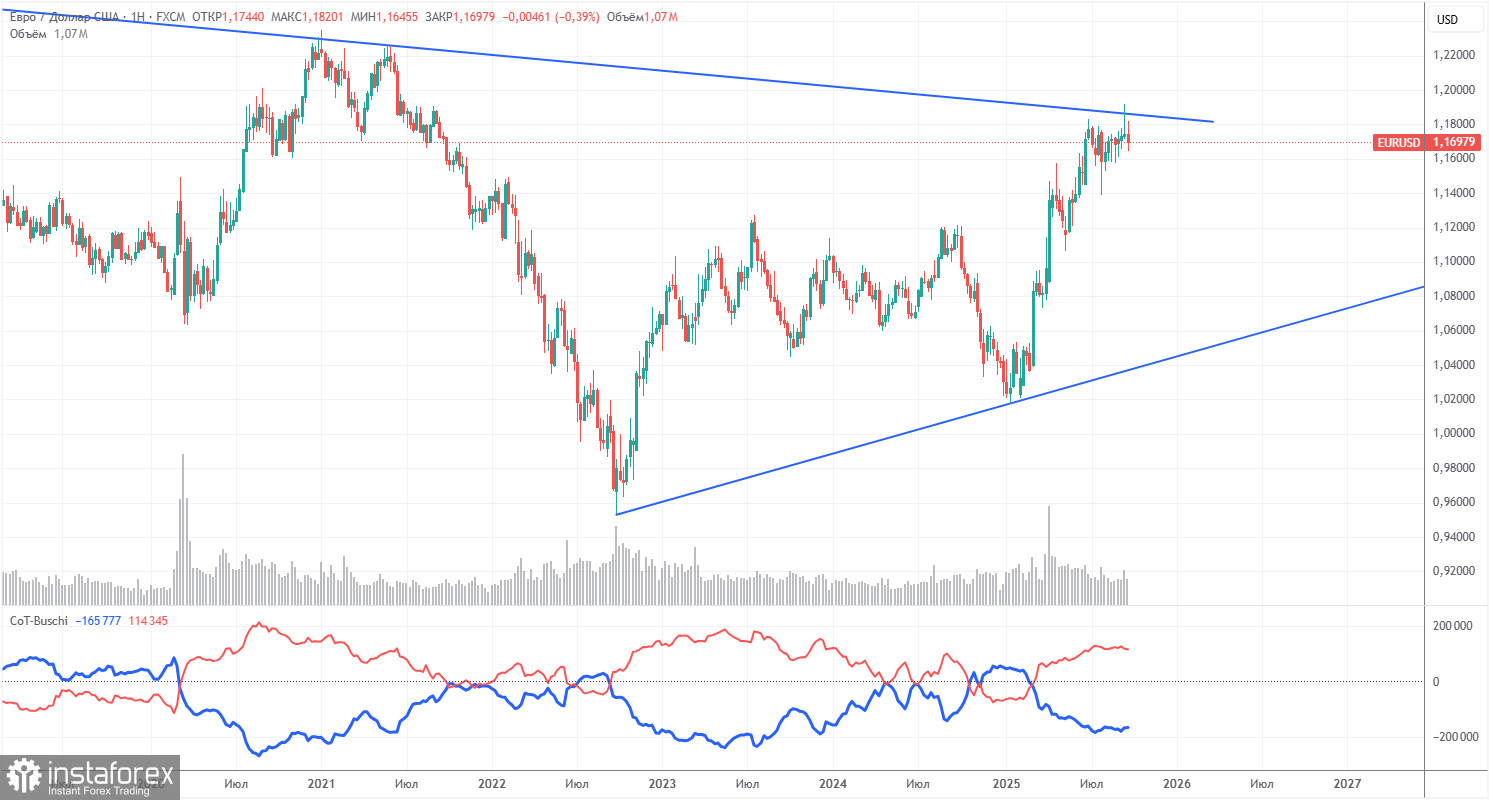
The latest COT report is dated September 23. As seen above, the net position of non-commercial traders had long been "bullish." Bears briefly gained the upper hand at the end of 2024 but quickly lost it. Since Trump began his second term as president, the dollar has been in steady decline. While we cannot claim with 100% certainty that this trend will continue, current global developments strongly suggest that it will.
There are still no fundamental factors supporting the dollar's strength, while many remain that support its decline. The global downtrend remains intact, and concerns about the Fed's potential loss of independence add further pressure on the U.S. currency.
During the last reporting week, longs among the "Non-commercial" group fell by 800 contracts, while shorts rose by 2,600. As a result, the net position decreased by 3,400 contracts.
EUR/USD Analysis, 1H
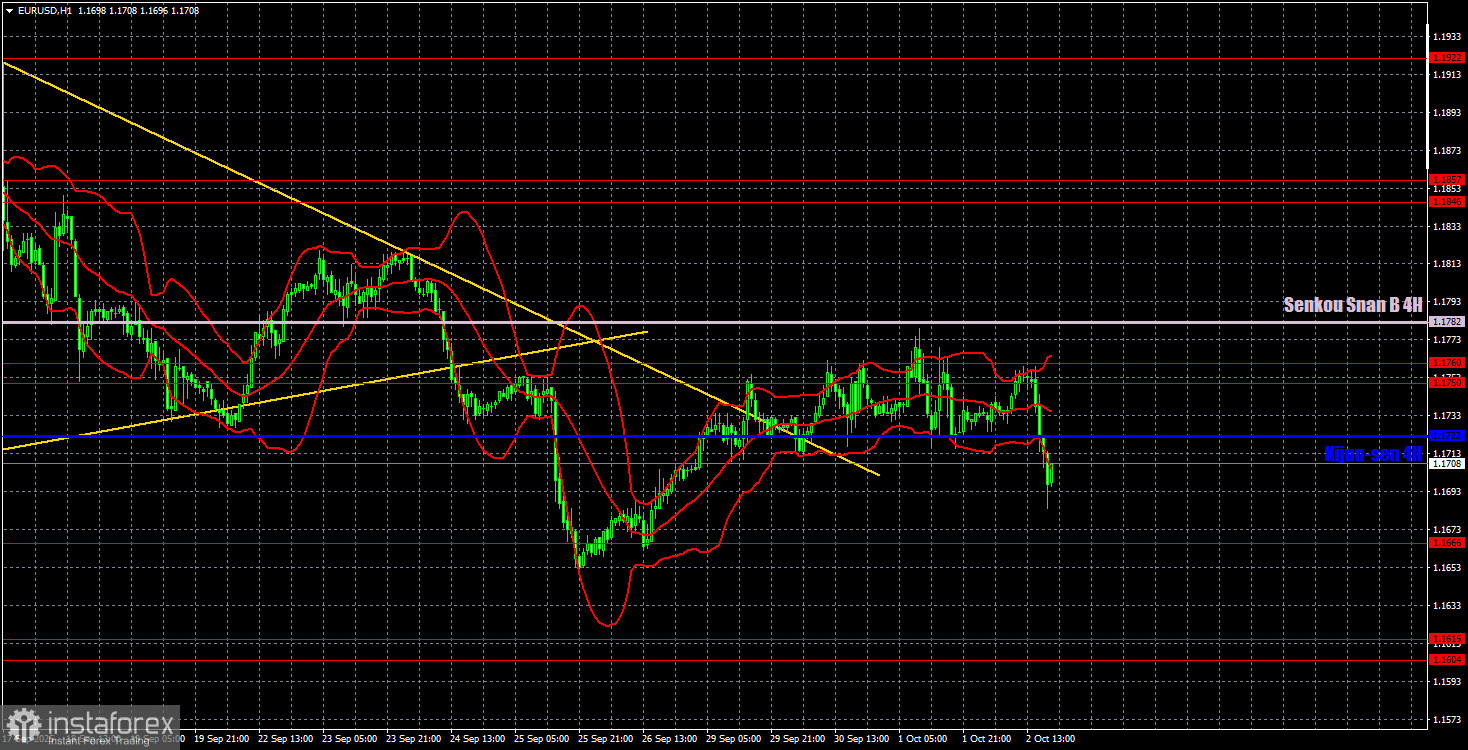
On the hourly chart, EUR/USD continues to form a downward trend, although it cannot yet be considered complete, as the price is moving sideways and has not broken the 1.1750–1.1760 area or the Senkou Span B line. However, we still see no grounds for sustained dollar growth. The daily chart clearly shows that the overall uptrend remains intact.
Key trading levels for October 3 are: 1.1234, 1.1274, 1.1362, 1.1426, 1.1534, 1.1604–1.1615, 1.1666, 1.1750–1.1760, 1.1846–1.1857, 1.1922, 1.1971–1.1988, along with Senkou Span B (1.1782) and Kijun-sen (1.1722). Lines of the Ichimoku indicator may shift during the day and should be monitored. Always set the Stop Loss to breakeven once the price moves 15 pips in the right direction. This reduces the risk of loss if a signal proves false.
On Friday, ECB President Christine Lagarde will deliver another speech, but no major policy shifts are expected. In the U.S., key reports are scheduled for release: Non-Farm Payrolls, the unemployment rate, and the ISM Manufacturing Index. However, the first two may not be published due to the shutdown.
Trading Recommendations
On Friday, the euro's recovery may continue. Traders need to overcome the 1.1750–1.1760 area and the Senkou Span B line for the downtrend to be considered broken. A rebound from this zone supported short entries with targets at 1.1666, but we still do not believe in a sustainable dollar rally—unless U.S. data surprises strongly to the upside.
Chart Notes:
- Support/Resistance Levels – thick red lines marking zones where movement may end. Not direct trading signals.
- Kijun-sen & Senkou Span B – Ichimoku indicator lines (shifted from H4 to H1), key technical levels.
- Extremum Levels – thin red lines marking past rebound zones, sources of trading signals.
- Yellow Lines – trend lines, channels, and other technical patterns.
- COT Indicator – shows net positions of trader categories.