 English
  Русский
 Bahasa Indonesia
 Bahasa Malay
 ไทย
ไทย Español
 Deutsch
 Български
 Français
 Tiếng Việt
 中文
中文 বাংলা
বাংলা हिन्दी
 Čeština
 Українська
 Română

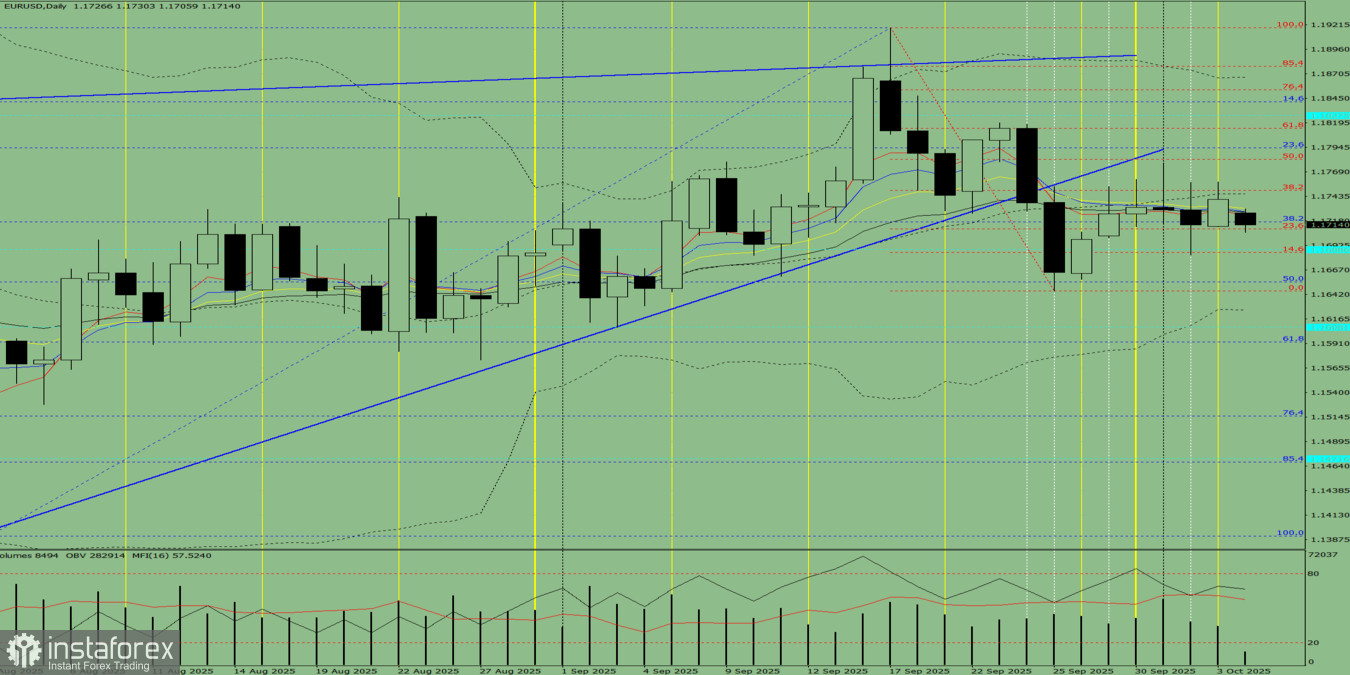
On Monday, from the 1.1741 level (Friday's daily candle close), the market may begin a downward move targeting 1.1685 – the 14.6% retracement level (red dotted line). Upon reaching this level, a possible upward move may occur toward 1.1689 – a historical resistance level (blue dotted line).
Fig. 1 (Daily chart).
Comprehensive Analysis:
- Indicator analysis – down;
- Fibonacci levels – down;
- Volumes – down;
- Candlestick analysis – down;
- Trend analysis – up;
- Bollinger Bands – down;
- Weekly chart – down.
Overall conclusion: Downward trend.
Alternative scenario: From the 1.1741 level (Friday's daily candle close), the price may begin a downward move targeting 1.1655 – the 50% retracement level (blue dotted line). Upon reaching this level, a possible upward move may occur toward 1.1685 – the 14.6% retracement level (red dotted line).